OPEN-SOURCE SCRIPT
Mis à jour Moving Average Gap Analyzer
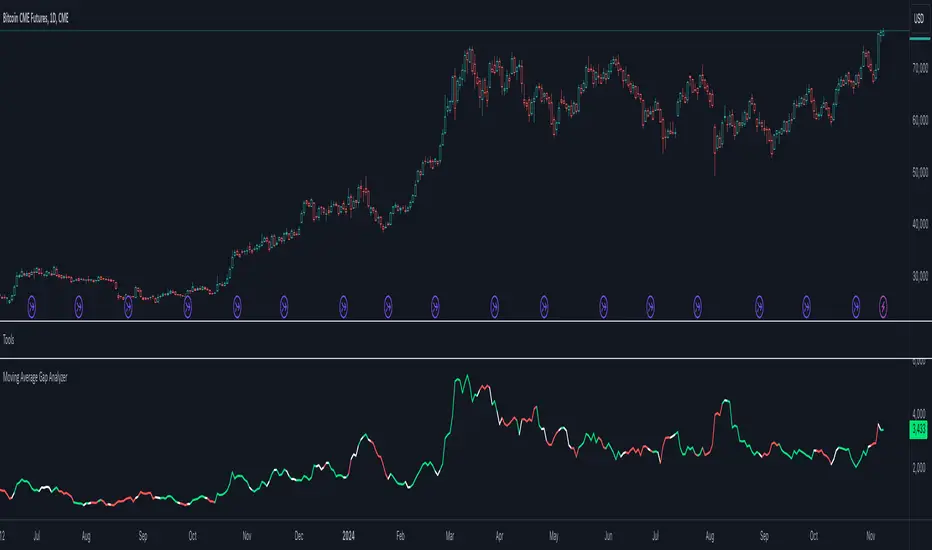
Extremely simple algorithm in order to calculate the gap between 2 simple moving averages. Analyzing perspective defines the line of color as white, green or red. This is done by checking sources of both moving averages and evaluate their past values with the mutual length respectively. Analysis is done by scoring the movements of sources.
What to expect?
- Higher the gap, higher the volatility.
- If the analysis line is green sources have been raising (most likely bull market), if the analysis line is white the market is mostly likely close to horizontal, if the analysis line is red, sources have been decreasing gradually (most likely bear market).
ps. Genuine indicator idea of me. This indicator is not a product or an idea of any group I work with. Completely clear of all types of IP.
Notes de version
- Option for selecting MA type added.Notes de version
- Script updated from Pine Script v4 to Pine Script v5
- Dynamic moving average function moved to a library (Tools)
- Strict variable types implemented & applied
Script open-source
Dans l'esprit TradingView, le créateur de ce script l'a rendu open source afin que les traders puissent examiner et vérifier ses fonctionnalités. Bravo à l'auteur! Bien que vous puissiez l'utiliser gratuitement, n'oubliez pas que la republication du code est soumise à nos Règles.
Clause de non-responsabilité
Les informations et publications ne sont pas destinées à être, et ne constituent pas, des conseils ou recommandations financiers, d'investissement, de trading ou autres fournis ou approuvés par TradingView. Pour en savoir plus, consultez les Conditions d'utilisation.