OPEN-SOURCE SCRIPT
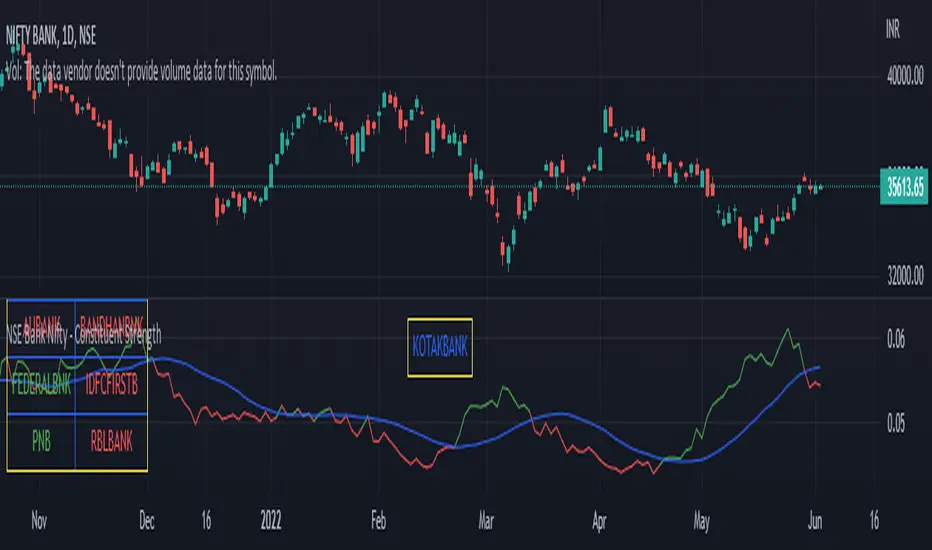
NSE Bank Nifty - Constituent Strength
NSE Bank Nifty - Constituent Strength
What is does:
Identifies how stocks under bank nifty index are performing if compared with bank nifty index.
Calculations:
A = Individual stock price
B = Bank nifty index price
C = A / B
D = average of A / B over length specified using input configuration
Stock is out-performing Bank nifty if A >= C
Stock is under-performing Bank nifty if A < C
Input Parameters:
Data source - For calculation of strength
Timeframe - For calculation of strength
Moving average type - SMA or EMA
Moving average length - Length for calculation of moving average
Show line chart for - One of the symbol from index constituents for showing line chart in the indicator window
S1 to S12 - Bank nifty stocks. Populated by default
Output:
Table listing each of the Bank nifty stocks
Stocks displayed in Green color are out-performing Bank nifty
Stocks displayed in Red color are under-performing Bank nifty
Line chart Price line - Blue colored line representing Stock price / Bank nifty price [point C from Calculations sections above]
Line chart Average line - Combination of Red, Green and Blue colors line representing average of Stock price / average of Bank nifty price [point D from Calculations sections above]
Script open-source
Dans l'esprit de TradingView, le créateur de ce script l'a rendu open-source, afin que les traders puissent examiner et vérifier sa fonctionnalité. Bravo à l'auteur! Vous pouvez l'utiliser gratuitement, mais n'oubliez pas que la republication du code est soumise à nos Règles.
Pour un accès rapide sur un graphique, ajoutez ce script à vos favoris - en savoir plus ici.
Clause de non-responsabilité
Les informations et les publications ne sont pas destinées à être, et ne constituent pas, des conseils ou des recommandations en matière de finance, d'investissement, de trading ou d'autres types de conseils fournis ou approuvés par TradingView. Pour en savoir plus, consultez les Conditions d'utilisation.