PROTECTED SOURCE SCRIPT
Mis à jour Trend, Momentum and Price value analysis Extended [deepakks444]
Trend, Momentum, and Price Value Analysis Extended [deepakks444]
This Pine Script™ indicator is designed to offer traders a comprehensive overview of price trends, momentum, and market strength through the use of several widely-recognized technical analysis tools. The indicator integrates multiple signals and plots directly on the chart, as well as a customizable table to help visually organize and interpret the data. Here’s an overview of the key features included:
Key Features:
VWAP (Volume-Weighted Average Price): Calculates the average price weighted by volume to give insight into whether the price is above or below the market's fair value.
Alligator Indicator: Uses a combination of three moving averages (jaw, teeth, and lips) to help identify trending conditions.
Supertrend: A trend-following indicator that signals potential buy or sell opportunities based on price movements relative to a dynamically calculated support/resistance line.
20-period Moving Average (MA): A basic moving average to smooth out price data and highlight the underlying trend.
MACD (Moving Average Convergence Divergence): Helps identify changes in the strength, direction, and momentum of a trend.
Volume with Moving Average: Compares current volume against its moving average to identify potential volume spikes.
RSI (Relative Strength Index): Measures the speed and change of price movements, signaling overbought or oversold conditions.
ADX (Average Directional Index): An indicator used to quantify trend strength, helping traders determine whether the market is trending or in a range.
Pivot Points: Calculates daily pivot points and identifies support and resistance levels based on price movements.
Bollinger Bands: A volatility indicator that uses standard deviation to highlight potential overbought or oversold conditions.
Customization Options:
Modify the length of the price and volume moving averages.
Adjust RSI thresholds for buy and sell signals.
Set the thresholds for ADX to differentiate between weak, average, and strong trends.
Toggle the visibility of the 20-period MA and Supertrend on the chart.
Choose to display the percentage difference between the current price and indicator values in the table.
Table Display:
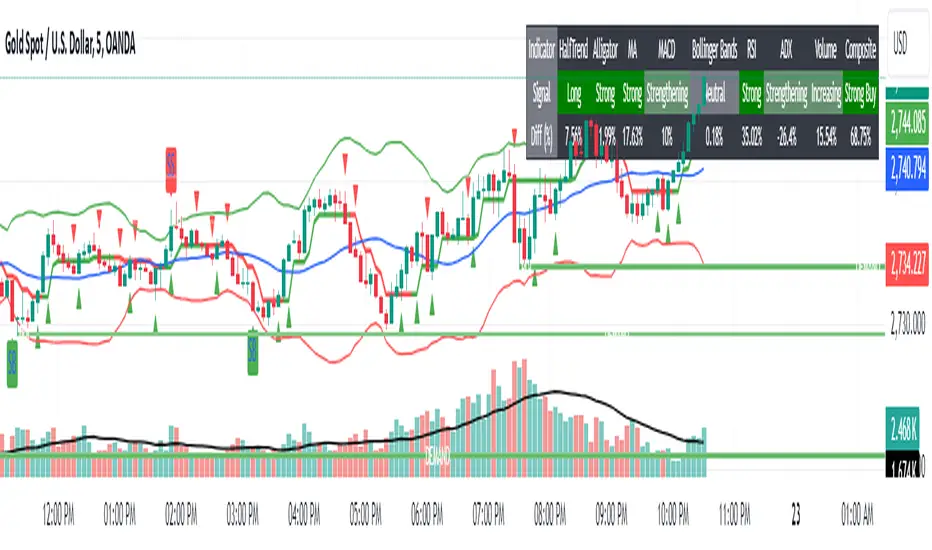
The indicator includes a table that summarizes the status of all signals, showing:
Signal (Buy/Sell/Neutral): Based on each indicator's interpretation of price action.
Percentage Difference: Optional display of how far the price is from the reference level (e.g., the difference between the price and VWAP, Supertrend line, or Moving Average).
The table allows traders to quickly assess the current market conditions across several indicators in one place, making it easier to gauge overall market sentiment.
Signal Logic:
This indicator uses a scoring system to calculate the percentage of indicators signaling a buy or sell. If the buy or sell score reaches 70% or higher, the indicator will plot buy or sell signals on the chart. The combined signal logic is displayed in the table as "Buy," "Sell," or "No Signal," based on the majority of the contributing indicators.
Intended Use:
This tool is designed to assist traders in their technical analysis by consolidating multiple popular indicators into one script. It provides a clear visual representation of various market signals, helping traders to make informed decisions about potential trade entries and exits. However, this indicator is for educational purposes and should not be used as financial advice. Traders should always use proper risk management and conduct their own research before making any trading decisions.
Disclaimer: This script is for educational purposes only and does not constitute financial advice. Trading involves risk, and past performance of an indicator does not guarantee future results. Please use it alongside proper risk management practices.
This Pine Script™ indicator is designed to offer traders a comprehensive overview of price trends, momentum, and market strength through the use of several widely-recognized technical analysis tools. The indicator integrates multiple signals and plots directly on the chart, as well as a customizable table to help visually organize and interpret the data. Here’s an overview of the key features included:
Key Features:
VWAP (Volume-Weighted Average Price): Calculates the average price weighted by volume to give insight into whether the price is above or below the market's fair value.
Alligator Indicator: Uses a combination of three moving averages (jaw, teeth, and lips) to help identify trending conditions.
Supertrend: A trend-following indicator that signals potential buy or sell opportunities based on price movements relative to a dynamically calculated support/resistance line.
20-period Moving Average (MA): A basic moving average to smooth out price data and highlight the underlying trend.
MACD (Moving Average Convergence Divergence): Helps identify changes in the strength, direction, and momentum of a trend.
Volume with Moving Average: Compares current volume against its moving average to identify potential volume spikes.
RSI (Relative Strength Index): Measures the speed and change of price movements, signaling overbought or oversold conditions.
ADX (Average Directional Index): An indicator used to quantify trend strength, helping traders determine whether the market is trending or in a range.
Pivot Points: Calculates daily pivot points and identifies support and resistance levels based on price movements.
Bollinger Bands: A volatility indicator that uses standard deviation to highlight potential overbought or oversold conditions.
Customization Options:
Modify the length of the price and volume moving averages.
Adjust RSI thresholds for buy and sell signals.
Set the thresholds for ADX to differentiate between weak, average, and strong trends.
Toggle the visibility of the 20-period MA and Supertrend on the chart.
Choose to display the percentage difference between the current price and indicator values in the table.
Table Display:
The indicator includes a table that summarizes the status of all signals, showing:
Signal (Buy/Sell/Neutral): Based on each indicator's interpretation of price action.
Percentage Difference: Optional display of how far the price is from the reference level (e.g., the difference between the price and VWAP, Supertrend line, or Moving Average).
The table allows traders to quickly assess the current market conditions across several indicators in one place, making it easier to gauge overall market sentiment.
Signal Logic:
This indicator uses a scoring system to calculate the percentage of indicators signaling a buy or sell. If the buy or sell score reaches 70% or higher, the indicator will plot buy or sell signals on the chart. The combined signal logic is displayed in the table as "Buy," "Sell," or "No Signal," based on the majority of the contributing indicators.
Intended Use:
This tool is designed to assist traders in their technical analysis by consolidating multiple popular indicators into one script. It provides a clear visual representation of various market signals, helping traders to make informed decisions about potential trade entries and exits. However, this indicator is for educational purposes and should not be used as financial advice. Traders should always use proper risk management and conduct their own research before making any trading decisions.
Disclaimer: This script is for educational purposes only and does not constitute financial advice. Trading involves risk, and past performance of an indicator does not guarantee future results. Please use it alongside proper risk management practices.
Notes de version
Trend, Momentum, and Price Value Analysis Extended [deepakks444]Description:
This script is a comprehensive multi-indicator strategy designed to analyze trends, momentum, and price action using a combination of several technical indicators. The strategy aggregates signals from various tools, including HalfTrend, Alligator, Moving Averages, ADX, RSI, MACD, Volume, and Bollinger Bands, to produce a robust view of market conditions. The ultimate goal is to give traders clear buy/sell signals based on diverse market metrics to improve decision-making accuracy.
Purpose:
This indicator is aimed at traders who want a multi-dimensional analysis of price movements, combining trend, momentum, and volatility indicators. By merging multiple indicators into one system, traders can benefit from:
Confirmation from multiple sources: Relying on several indicators helps validate signals and reduce the risk of false positives from any single tool.
Comprehensive market insight: Each indicator provides unique insight into the market—whether it's about trend direction, volatility, or momentum. Combining these insights offers a holistic market view.
Automated signal generation: The indicator aggregates scores from different sources to simplify decision-making, allowing traders to focus on key buy/sell signals rather than managing multiple indicators separately.
Why Combine Multiple Indicators?
The primary reason for combining multiple indicators is to minimize false signals and provide more accurate trading signals by taking into account different aspects of price movement:
Trend Analysis: HalfTrend, Alligator, and Moving Averages are used to detect long-term and short-term trends.
Momentum: RSI, ADX, and MACD are used to assess the strength of the current market trend, helping to determine whether it is strengthening or weakening.
Volatility: Bollinger Bands are incorporated to detect overbought or oversold conditions based on volatility, while Volume analysis provides additional context to price movements.
By using these diverse indicators, the script reduces the risk of relying on one particular tool and avoids false signals caused by random market noise.
How the Indicators Work Together:
Each indicator in the system plays a specific role:
HalfTrend: This indicator helps identify major price trends based on breakouts of support or resistance. It is plotted with buy/sell arrows to show potential reversals in the market, either from a bearish to bullish trend (Buy) or a bullish to bearish trend (Sell).
Alligator: This indicator, comprised of three SMAs (Jaw, Teeth, Lips), helps detect trends and their strength by analyzing the alignment of these averages. The script identifies whether the trend is strong, strengthening, weakening, or weak.
Moving Averages (MA): The script uses a simple moving average (SMA) of the closing price to assess whether the price is above or below the average. It also takes into account the ATR to evaluate whether the movement is strong or weak. This provides context on whether the market is in a trending phase or potential reversal.
ADX (Average Directional Index): ADX measures the strength of the trend. Rising ADX suggests a strengthening trend, while a declining ADX suggests weakening. The script classifies trends into strong, strengthening, weakening, and weak categories.
RSI (Relative Strength Index): RSI is used to measure the momentum of the market. The script generates buy or sell signals based on RSI values exceeding specific thresholds (e.g., 60 for strong momentum and 40 for weak momentum).
MACD (Moving Average Convergence Divergence): MACD is a trend-following momentum indicator that identifies the relationship between two moving averages of a security's price. The script compares the MACD line with the signal line and generates signals based on crossovers.
Volume Analysis: The script measures the volume against a moving average of volume to determine whether there is high or low trading activity. This helps confirm the validity of trends or reversals—strong movements with high volume are more reliable than those with low volume.
Bollinger Bands: Bollinger Bands are used to identify periods of high or low volatility and potential reversals when prices close significantly outside the bands. The script generates buy or sell signals when price closes way out of the bands, indicating potential overbought or oversold conditions.
How the Signals are Aggregated:
Each indicator produces a signal, which is scored based on its strength:
Strong signals contribute 2 points.
Mild signals contribute 1 point.
Weak signals subtract 1 or 2 points, depending on severity.
These scores are combined to form a Composite Signal, which summarizes the overall market condition into one of the following:
Strong Buy
Mild Buy
Strong Sell
Mild Sell
Neutral
The signal also displays percentage-based strength for both buy and sell recommendations, providing traders with insights into the strength of each signal.
Compliance with TradingView House Rules:
This indicator follows TradingView’s house rules by:
Transparency: Each indicator’s calculation is clearly explained, and no black-box logic is applied. The purpose of combining indicators is well-defined and rational.
No Misleading Claims: The script does not promise guaranteed profits or suggest unrealistic expectations. It provides insights based on widely accepted technical analysis tools, leaving traders to interpret signals in the context of their own trading strategy.
Proper Use of Alerts: Alerts are set up in a straightforward manner, only triggering when the signals meet predefined conditions (e.g., crossover, trend change). There is no excessive or unnecessary use of alerts.
Clarity: The script is easy to interpret, with visual cues on the chart (buy/sell arrows, threshold lines, and a table with clear indicator outputs). There is no ambiguity in how the signals are generated.
Conclusion:
This strategy merges trend, momentum, and volatility indicators to create a well-rounded market analysis tool. It simplifies complex calculations into actionable buy/sell signals, helping traders make informed decisions while avoiding false positives from any single indicator.
Usage Disclaimer:
This indicator is provided for informational and educational purposes only. It is designed to assist traders in analyzing market trends, momentum, and volatility using technical indicators. However, it is important to note the following:
Not Financial Advice: The signals generated by this indicator should not be considered financial advice or a recommendation to buy, sell, or hold any financial instrument. Users should perform their own due diligence and consult with a financial advisor before making any trading decisions.
Script protégé
Ce script est publié en source fermée. Cependant, vous pouvez l'utiliser librement et sans aucune restriction – pour en savoir plus, cliquez ici.
Clause de non-responsabilité
Les informations et publications ne sont pas destinées à être, et ne constituent pas, des conseils ou recommandations financiers, d'investissement, de trading ou autres fournis ou approuvés par TradingView. Pour en savoir plus, consultez les Conditions d'utilisation.