OPEN-SOURCE SCRIPT
Acceleration Bands HTF
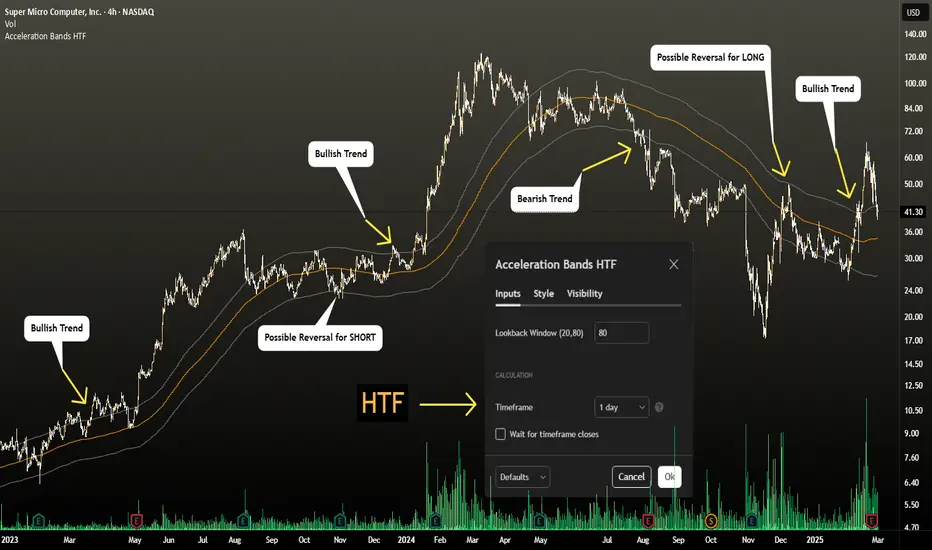
This version gives you the ability to see the indicator from the HIGHER timeframes when you are on the timeframes. Please note that this is not the original formula, but a factored one that I found effective for identifying market trends. Thanks to capissimo who provided the base open-code.
Acceleration Bands are designed to capture potential price breakouts or reversals in an asset. They are calculated based on a stock's price movements over a specified period, typically using the high, low, and closing prices. The idea is to identify moments when the price is accelerating (hence the name) beyond its normal range, which might indicate the beginning of a new trend.
Calculation
Acceleration Bands consist of three lines:
Upper Band (AB Upper): This is calculated by adding a certain percentage of the simple moving average (SMA) to the highest high over a given period.
Middle Band: This is typically the SMA of the stock's price.
Lower Band (AB Lower): This is calculated by subtracting the same percentage of the SMA from the lowest low over a given period.
Mathematically [original formulas]:
AB Upper = SMA + (Highest High * Percentage)
AB Lower = SMA - (Lowest Low * Percentage)
OR
Upper Band = SMA x (1 + (High - Low) / SMA)
Lower Band = SMA x (1 - (High - Low) / SMA)
Interpretation
The bands are used to identify periods when the price of a security is accelerating or decelerating:
Breakout Above Upper Band: This is usually considered a bullish signal, suggesting that the price is accelerating upwards and a new uptrend may be starting.
Breakdown Below Lower Band: This is usually considered a bearish signal, suggesting that the price is accelerating downwards and a new downtrend may be starting.
Reversal Between Bands: When the price re-enters the region between the bands after breaking out, it can be seen as a potential reversal signal.
Trading Strategy
Entry Signals:
Buy when the price breaks above the upper band.
Sell or short when the price breaks below the lower band.
Exit Signals:
Close a long position when the price falls back into the area between the bands.
Close a short position when the price rises back into the area between the bands.
Advantages
Helps capture early trends.
Can be used across various time frames and assets.
Provides clear entry and exit signals.
Script open-source
Dans l'esprit TradingView, le créateur de ce script l'a rendu open source afin que les traders puissent examiner et vérifier ses fonctionnalités. Bravo à l'auteur! Bien que vous puissiez l'utiliser gratuitement, n'oubliez pas que la republication du code est soumise à nos Règles.
🏆 There is only #1 way to trading
🧪 Feel confident with science and logic
💰 Trade your way to success and freedom
🧪 Feel confident with science and logic
💰 Trade your way to success and freedom
Clause de non-responsabilité
Les informations et publications ne sont pas destinées à être, et ne constituent pas, des conseils ou recommandations financiers, d'investissement, de trading ou autres fournis ou approuvés par TradingView. Pour en savoir plus, consultez les Conditions d'utilisation.