OPEN-SOURCE SCRIPT
BoS yellow candle

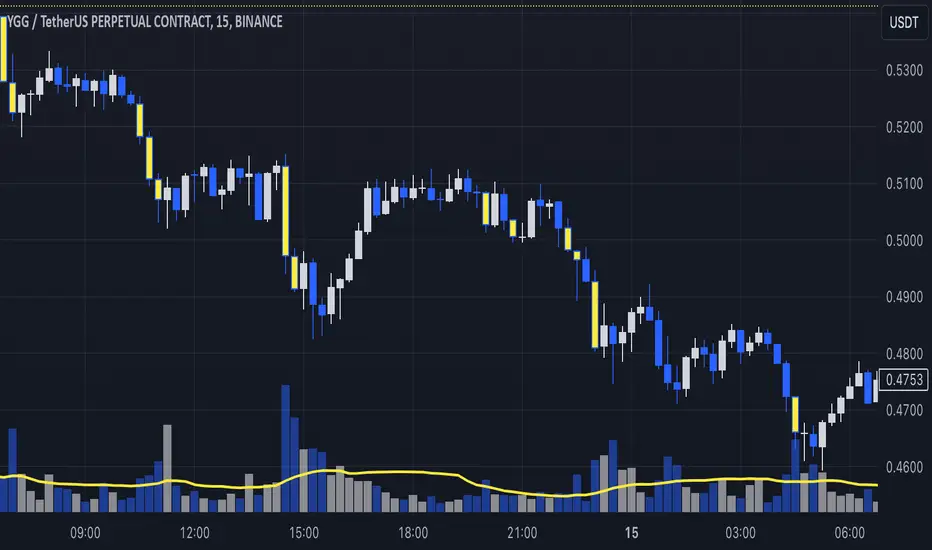
The "BoS Yellow Candle" indicator identifies and highlights the first candle that breaks a Break of Structure (BoS) in a given look-back period. A BoS occurs when the price either breaks above the highest high or below the lowest low within a user-defined look-back range (default set between 7 and 12 candles).
Bullish Break of Structure: The first candle to break above the previous high is marked with a yellow body.
Bearish Break of Structure: The first candle to break below the previous low is also marked with a yellow body.
This visual aid helps traders quickly identify potential structural breakouts for further analysis or strategy development.
Clause de non-responsabilité
Les informations et les publications ne sont pas destinées à être, et ne constituent pas, des conseils ou des recommandations en matière de finance, d'investissement, de trading ou d'autres types de conseils fournis ou approuvés par TradingView. Pour en savoir plus, consultez les Conditions d'utilisation.