PROTECTED SOURCE SCRIPT
Mis à jour Cumulative volume analysis

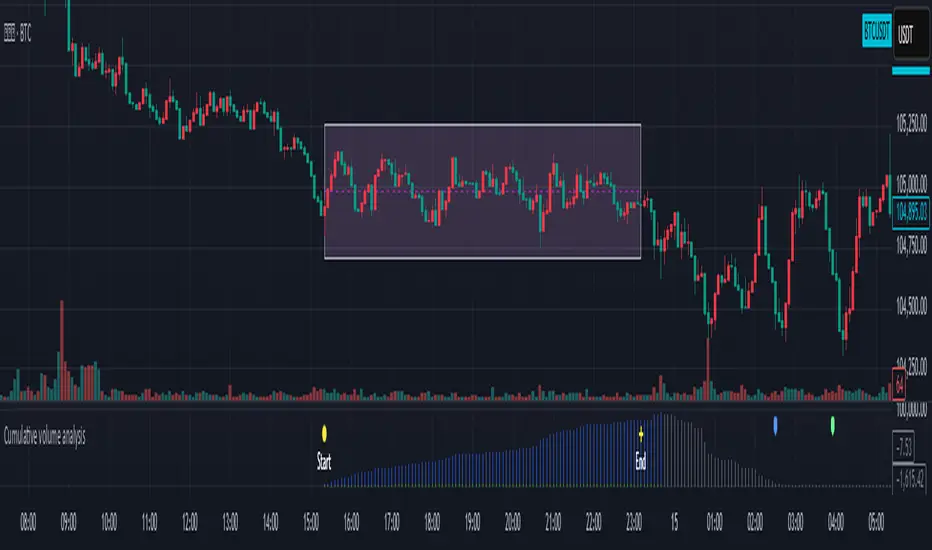
After user define the ragion area. While break out the region area, you can try this indicator to notice when the power is ended and maybe reverse the trend.
1. The user enters the start time, and end time
2. The indicator will record the highest, lowest price, and cumulative amount during this period.
The cumulative amount is calculated by adding up the amount of each K bar, regardless of whether it rises or falls.
3. When the cumulative amount is reduced to less than or equal to 0, make a plotshape arrow
4.There are two diferent method to record the volume. Try the better way to different product.
Notes de version
Added more explanation below:This indicator is suitable for short-term use. I prefer the range of 5 minutes K to 1 hour K.
The chart uses 5 points K as an example.
I think this concept is my own idea, and there is no plagiarism.
If you like it, like it or share it
Notes de version
Change some description into English version.Script protégé
Ce script est publié en source fermée. Cependant, vous pouvez l'utiliser librement et sans aucune restriction – pour en savoir plus, cliquez ici.
Clause de non-responsabilité
Les informations et publications ne sont pas destinées à être, et ne constituent pas, des conseils ou recommandations financiers, d'investissement, de trading ou autres fournis ou approuvés par TradingView. Pour en savoir plus, consultez les Conditions d'utilisation.
Script protégé
Ce script est publié en source fermée. Cependant, vous pouvez l'utiliser librement et sans aucune restriction – pour en savoir plus, cliquez ici.
Clause de non-responsabilité
Les informations et publications ne sont pas destinées à être, et ne constituent pas, des conseils ou recommandations financiers, d'investissement, de trading ou autres fournis ou approuvés par TradingView. Pour en savoir plus, consultez les Conditions d'utilisation.