OPEN-SOURCE SCRIPT
Mis à jour Vortex Indicator With SMA
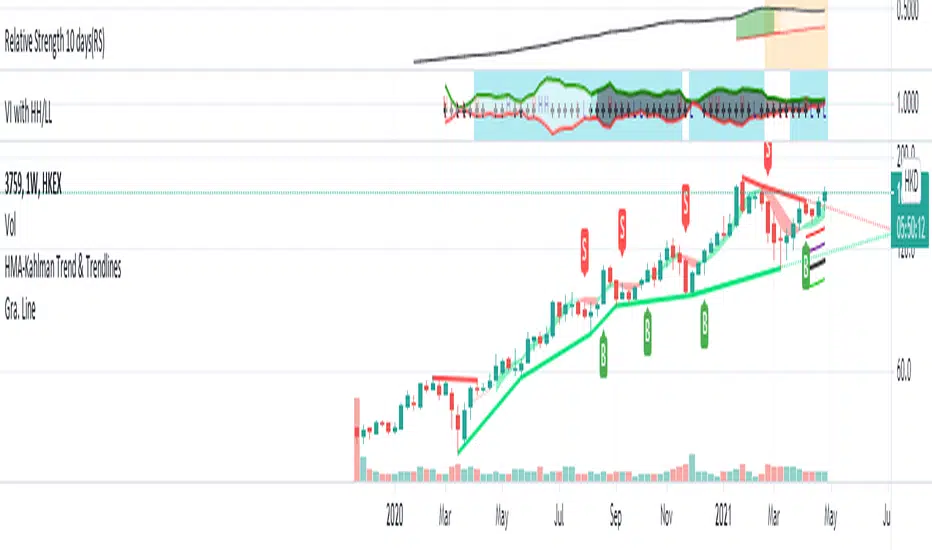
VI with SMA to determine the trend is solid.
VI+ cross over VI- with price over 20 SMA to confirm the trend.
Also, you can see the enhanced trend:
VI+ with the Letter H, with new high in the observe period.
VI- with the Letter L, with new high in the observe period.
Coding based on the original Vortex Indicator.
VI+ cross over VI- with price over 20 SMA to confirm the trend.
Also, you can see the enhanced trend:
VI+ with the Letter H, with new high in the observe period.
VI- with the Letter L, with new high in the observe period.
Coding based on the original Vortex Indicator.
Notes de version
Add Test VI+, VI- with uptrend STR (Sum of ATR)Notes de version
Check stocks SMA uptrend sequence with VINotes de version
Uptrend SMA Seq. title.Notes de version
1: Modified the Background highlight factor:either use SMA or Donchain Channel mid line as Oscillator.
2: Fill the area between VI+ and VI - when the SMA uptrend Sequence is valid.
Notes de version
Traditionally, vortex indicator (VI) is an indicator composed of two lines : an uptrend line (VI+) : measure the price of the stock going up
a downtrend line (VI-) : measure the price of the stock going down
bleached areas within two VI lines is showing the "the fastEMA above slowEMA" of the stock.
eg. SMA10 > SMA40
"H" means that the VI+ > 5 days average VI+, which means stock price is move up relative to the price past 5 days average. ( simply is price action hgiher high)
"L" means that the VI- > 5 days average VI-, which means stock price decline relative to the price past 5 days average. ( simply is price action lower low)
In conclusion, I create this indicator help to easily knowing a stock is in uptrend and the momentum is maintain.
Two examples:
Look for Uptrend stock
1) the trading logic is looking for uptrend stocks (with blue background).
2) blue background where [VI+ is above VI- ] and [ stock price is above EMA or Donchain channel] .
3) "H" equal to [ VI+ is increase ] means the up-force is improving. "H" in red mean the price velocity is increase.
4) it is better hold the stock when the VI+ is keep move up. and be alert the "L" show up.
Look for Bottom UP/Breakout
1) when the background is in PINK, means [ VI- > VI+ ]. Stock is in downtrend.
2) waiting for the word "H" show up in frequent (several times), mean the stock price start have a high compare 5 days average.
3) wait for the crossover of the VI+ and VI- and the background to Blue.
Script open-source
Dans l'esprit TradingView, le créateur de ce script l'a rendu open source afin que les traders puissent examiner et vérifier ses fonctionnalités. Bravo à l'auteur! Bien que vous puissiez l'utiliser gratuitement, n'oubliez pas que la republication du code est soumise à nos Règles.
Clause de non-responsabilité
Les informations et publications ne sont pas destinées à être, et ne constituent pas, des conseils ou recommandations financiers, d'investissement, de trading ou autres fournis ou approuvés par TradingView. Pour en savoir plus, consultez les Conditions d'utilisation.