OPEN-SOURCE SCRIPT
Mis à jour MTF EMA Monitor CQ

ENGLISH
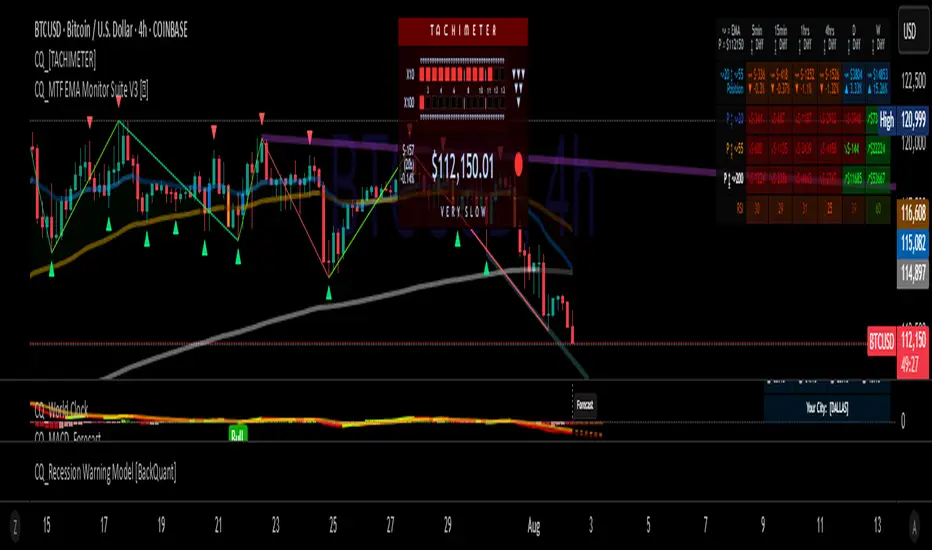
This Dashboard allows you to monitor the Dollar difference between EMAS, if the Dollar difference between EMAS is around $200 on all 3, it is a good entry point for the time frame in which it is happening. It allows you to monitor 15M, 1H, 4H, 1D and 1W timeframes.
SPANISH
Este tablero permite monitorear la diferencia en Dolares entre EMAS, Si la diferencia es de alrededor de $200 en las 3 EMAS, podria ser una buena entrada para la temporalidad en que esta sucediendo. Permite monitorear temporalidades de 15M, 1H, 4H, 1D y 1S.
Notes de version
ENGLISHThis Dashboard allows you to monitor the Dollar difference between EMAS, if the Dollar difference between EMAS is around $200 on all 3, it is a good entry point for the time frame in which it is happening. It allows you to monitor 15M, 1H, 4H, 1D and 1W timeframes.
Each cell changes color according to the tendency, if the difference is negative, the cell color is red and if it is positive the cell is green. If the change is close to the zero value, the text color will change only if the difference is significative.
SPANISH
Este tablero permite monitorear la diferencia en Dolares entre EMAS, Si la diferencia es de alrededor de $200 en las 3 EMAS, podria ser una buena entrada para la temporalidad en que esta sucediendo. Permite monitorear temporalidades de 15M, 1H, 4H, 1D y 1S.
Cada celda cambia de color de acuerdo a la tendencia. Si la diferencia es negativa, el color de la celda es rojo y si es positiva la celda es verde. Si el cambio es cercano al valor cero el color del texto no cambiara, el color del texto cambiara solo si la diferencia es significativa.
Notes de version
English:Added ability to plot EMAS
Added Alerts on charts at EMA crosses
Color Candles according to EMA values
Español
Se agregó habilidad de plotear EMAS
Se agregaron alertas cuando crucen las EMAS
Coloriza las candelas de acuerdo al valor de las EMAS
Notes de version
New smaller design.Easier to read.
Title color of third row, based on weekly trend.
Color of EMA titles corresponding to respective EMA plot color.
Enjoy!
Notes de version
ENGLISHAdded ability to look for the best Long Entry, monitoring the moment in which the price hits the desired EMA on a Bullish Market or a price bounce, the default EMA length is 55, but can be changed, the desired EMA line will be drawn accordingly.
You can select the time frame of your preference, for each column of the chart, so the EMA monitoring can be customized to your needs.
SPANISH
Se agregó la habilidad de buscar la mejor entrada en Long, moitoreando el momento en el que el precio toca la EMA deseada en un mercado alcista o un rebote del precio. Por omisión, se usa la EMA de 55 periodos. Puede cambiarse a la EMA deseada y se dibujará también la correspondiente EMA en la gráfica.
Ahora se puede seleccionar la temporalidad de cada columna individualmente en el monitor de EMAs, de tal forma que se ajuste mejor a sus preferencias de trading.
Notes de version
Major Update:Modified the colors of the dashboard to make it easier to read.
Added LuxAlgo's Echo price prediction script.
Added Price Tendency Reversal indicators to complement the EMA based Buy/Sell Indicator.
Actualización Grande:
Se modificó los colores del dashboard para hacerlo mas fácil de leer.
Se agregó el Script de LuxAlgo Echo que predice la tendencia del precio.
Se agregó un indicador de Reversión de Tendencia del precio para complementar el indicador de Compra/Venta basado en las EMAs.
Enjoy!
Notes de version
English:- Improved Visibility
- Minor corrections to script
Spanish:
- Visibilidad Mejorada
- Pequeñas correcciones al script
Notes de version
Updated the script, added some features.Notes de version
Added MTF RSI display on table.Notes de version
Updated gauges design and colors.Script open-source
Dans l'esprit de TradingView, le créateur de ce script l'a rendu open-source, afin que les traders puissent examiner et vérifier sa fonctionnalité. Bravo à l'auteur! Vous pouvez l'utiliser gratuitement, mais n'oubliez pas que la republication du code est soumise à nos Règles.
Clause de non-responsabilité
Les informations et les publications ne sont pas destinées à être, et ne constituent pas, des conseils ou des recommandations en matière de finance, d'investissement, de trading ou d'autres types de conseils fournis ou approuvés par TradingView. Pour en savoir plus, consultez les Conditions d'utilisation.
Script open-source
Dans l'esprit de TradingView, le créateur de ce script l'a rendu open-source, afin que les traders puissent examiner et vérifier sa fonctionnalité. Bravo à l'auteur! Vous pouvez l'utiliser gratuitement, mais n'oubliez pas que la republication du code est soumise à nos Règles.
Clause de non-responsabilité
Les informations et les publications ne sont pas destinées à être, et ne constituent pas, des conseils ou des recommandations en matière de finance, d'investissement, de trading ou d'autres types de conseils fournis ou approuvés par TradingView. Pour en savoir plus, consultez les Conditions d'utilisation.