OPEN-SOURCE SCRIPT
Mis à jour Support & Resistance Parser
I've created a user-friendly trading indicator that interprets and visually presents support and resistance levels, transforming raw data into actionable insights.
Here's a glimpse of what you might encounter:
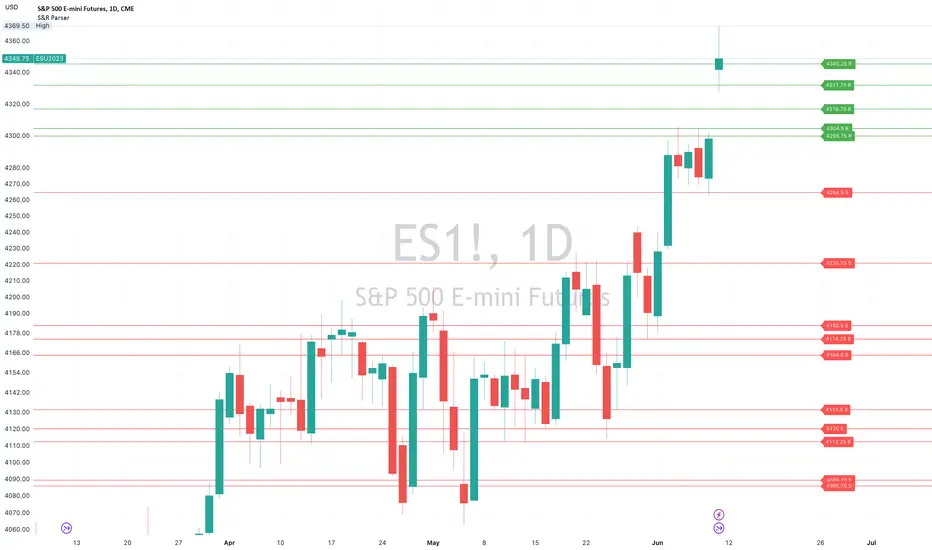
Today's trigger points (ES)
Support: 4264.5,4220.75,4131.5,4164.5,3980.75,4182.5,4174.25,4120,4112.25,4089.25,4085.75
Resistance: 4299.75,4304.5,4316.75,4345.25,4331.75
This is how it works:
1. Copy the series of support and resistance figures, ie just the comma separated numbers
2. Paste each series into their respective setting in the indicator.
3. The indicator parses the data, understanding the sequence and importance of each figure.
4. It then draws the corresponding support and resistance lines on your trading chart.
Chart would appear similar to the following:

This tool distinguishes itself with its user-friendly features. Each line comes with adjustable labels, enabling users to personalize their visualization. This makes the data more intuitive and easier to comprehend, enhancing decision-making during trades.
Note: The indicator includes limited error handling capabilities.
Make the most out of your trading journey with this intuitive and customizable tool, specifically designed to turn raw data into valuable trading insights.
Here's a glimpse of what you might encounter:
Today's trigger points (ES)
Support: 4264.5,4220.75,4131.5,4164.5,3980.75,4182.5,4174.25,4120,4112.25,4089.25,4085.75
Resistance: 4299.75,4304.5,4316.75,4345.25,4331.75
This is how it works:
1. Copy the series of support and resistance figures, ie just the comma separated numbers
2. Paste each series into their respective setting in the indicator.
3. The indicator parses the data, understanding the sequence and importance of each figure.
4. It then draws the corresponding support and resistance lines on your trading chart.
Chart would appear similar to the following:
This tool distinguishes itself with its user-friendly features. Each line comes with adjustable labels, enabling users to personalize their visualization. This makes the data more intuitive and easier to comprehend, enhancing decision-making during trades.
Note: The indicator includes limited error handling capabilities.
Make the most out of your trading journey with this intuitive and customizable tool, specifically designed to turn raw data into valuable trading insights.
Notes de version
Updating ChartScript open-source
Dans l'esprit TradingView, le créateur de ce script l'a rendu open source afin que les traders puissent examiner et vérifier ses fonctionnalités. Bravo à l'auteur! Bien que vous puissiez l'utiliser gratuitement, n'oubliez pas que la republication du code est soumise à nos Règles.
Clause de non-responsabilité
Les informations et publications ne sont pas destinées à être, et ne constituent pas, des conseils ou recommandations financiers, d'investissement, de trading ou autres fournis ou approuvés par TradingView. Pour en savoir plus, consultez les Conditions d'utilisation.
Script open-source
Dans l'esprit TradingView, le créateur de ce script l'a rendu open source afin que les traders puissent examiner et vérifier ses fonctionnalités. Bravo à l'auteur! Bien que vous puissiez l'utiliser gratuitement, n'oubliez pas que la republication du code est soumise à nos Règles.
Clause de non-responsabilité
Les informations et publications ne sont pas destinées à être, et ne constituent pas, des conseils ou recommandations financiers, d'investissement, de trading ou autres fournis ou approuvés par TradingView. Pour en savoir plus, consultez les Conditions d'utilisation.