OPEN-SOURCE SCRIPT
Stochastic Momentum Index _ UCSgears
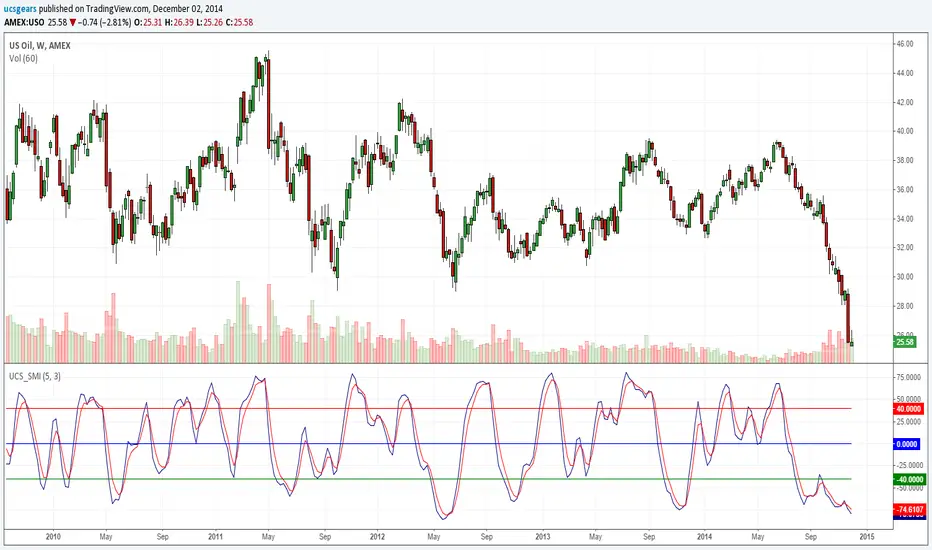
The Stochastic Momentum Index (SMI) was introduced by William Blau in 1993 as a way to clarify the traditional stochastic oscillator. SMI helps you see where the current close has taken place relative to the midpoint of the recent high to low range is based on price change in relation to the range of the price. This is a range based indicator, when used right. It can help momentum changes.
For those looking for help understanding this -
wiki.timetotrade.eu/Stochastic_Momentum_Index
tradingstrategyideas.com/entries/stochastic-momentum-index/
tlc.thinkorswim.com/center/charting/studies/studies-library/R-S/StochasticMomentumIndex.html
sierrachart.com/supportboard/attachment.php?attachmentid=4714&d=1277899234
Script open-source
Dans l'esprit TradingView, le créateur de ce script l'a rendu open source afin que les traders puissent examiner et vérifier ses fonctionnalités. Bravo à l'auteur! Bien que vous puissiez l'utiliser gratuitement, n'oubliez pas que la republication du code est soumise à nos Règles.
Uday C Santhakumar
udaycs.substack.com/
udaycs.substack.com/
Clause de non-responsabilité
Les informations et publications ne sont pas destinées à être, et ne constituent pas, des conseils ou recommandations financiers, d'investissement, de trading ou autres fournis ou approuvés par TradingView. Pour en savoir plus, consultez les Conditions d'utilisation.