OPEN-SOURCE SCRIPT
paranimonipobre
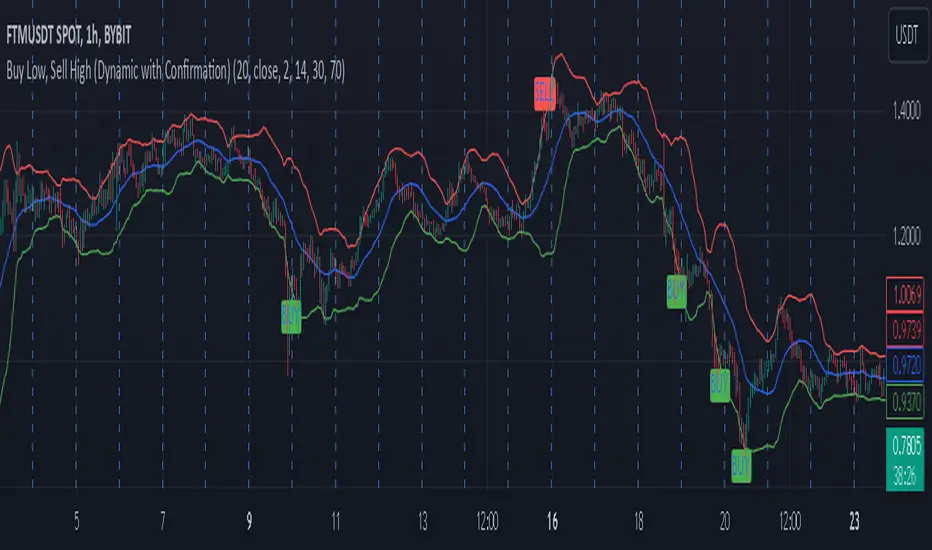
Chart Description: Buy Low, Sell High with Market Structure
This chart utilizes a dynamic trading strategy based on Bollinger Bands, RSI, and market structure analysis to identify high-probability buy and sell signals while aligning with prevailing trends.
Key Elements:
Bollinger Bands:
The upper (red) and lower (green) bands define volatility boundaries based on standard deviations.
The middle line (blue) represents the 20-period simple moving average.
Market Structure:
Swing highs (red triangles labeled "SH") and swing lows (green triangles labeled "SL") are identified to analyze the trend.
Background colors indicate trend direction:
Green Background: Uptrend (Higher Lows).
Red Background: Downtrend (Lower Highs).
RSI Indicator:
Shown in a separate pane, with overbought (red) at 70 and oversold (green) at 30.
Helps confirm signal validity by identifying momentum extremes.
Buy and Sell Signals:
Buy Signals (Green):
Triggered when the price crosses above the lower Bollinger Band, RSI is oversold (<30), and the market is in an uptrend.
Displayed as green "BUY" labels below bars.
Sell Signals (Red):
Triggered when the price crosses below the upper Bollinger Band, RSI is overbought (>70), and the market is in a downtrend.
Displayed as red "SELL" labels above bars.
How to Use:
Trend Identification:
Follow market structure analysis to determine the current trend direction.
Trade only in the direction of the trend (e.g., buy in an uptrend, sell in a downtrend).
Signal Confirmation:
Look for signals aligning with Bollinger Bands, RSI levels, and market structure.
Ignore signals that conflict with the trend to avoid false entries.
Market Conditions:
Best suited for trending markets with clear higher lows or lower highs.
Signals in choppy or sideways markets may require additional confirmation.
Script open-source
Dans l'esprit de TradingView, le créateur de ce script l'a rendu open-source, afin que les traders puissent examiner et vérifier sa fonctionnalité. Bravo à l'auteur! Vous pouvez l'utiliser gratuitement, mais n'oubliez pas que la republication du code est soumise à nos Règles.
Pour un accès rapide sur un graphique, ajoutez ce script à vos favoris - en savoir plus ici.
Clause de non-responsabilité
Les informations et les publications ne sont pas destinées à être, et ne constituent pas, des conseils ou des recommandations en matière de finance, d'investissement, de trading ou d'autres types de conseils fournis ou approuvés par TradingView. Pour en savoir plus, consultez les Conditions d'utilisation.