Que sont les graphiques linéaires avec marqueurs
Le graphique linéaire avec marqueurs est un type de graphique linéaire, mais contrairement au graphique original, il est construit à partir de points distincts (marqueurs) à chaque point de données sur la ligne. Il est couramment utilisé pour suivre l'évolution du prix des actifs au fil du temps tout en mettant en évidence des points de données spécifiques pour plus de clarté. Il est disponible sur nos Supercharts et peut être utilisé avec des dessins, des indicateurs et d'autres outils d'analyse financière.
SOMMAIRE :
- Qu'est-ce qu'un graphique en ligne avec marqueurs
- Graphique en ligne avec marqueurs vs ligne simple
- Activer ce type de graphique
- Paramètres
Qu'est-ce qu'un graphique en ligne avec marqueurs
Ce type de graphique est similaire aux graphiques en ligne classiques, à la seule différence que les marqueurs mettent en évidence des niveaux de prix spécifiques à chaque point de données, aidant ainsi les traders à repérer rapidement les niveaux de prix.
Par défaut, les graphiques en ligne utilisent les prix de clôture, reliés par une ligne continue. Dans ce cas, les marqueurs représentent les prix de clôture.
Graphique en ligne avec marqueurs vs ligne simple
Même si ces deux types de graphiques semblent être « les mêmes, mais avec des marqueurs », ce petit ajustement peut changer considérablement votre perception du graphique et des points de données.
Comme les Supercharts ne se limitent pas aux prix des actifs — vous pouvez par exemple visualiser des taux d’intérêt, des taux d’inflation ou des rendements obligataires — les marqueurs peuvent s’avérer très utiles pour repérer précisément ces valeurs dans certains cas.

Ligne avec marqueurs
- Met en valeur à la fois les tendances et les points de données individuels
- Peut mieux convenir que les lignes simples pour mettre en évidence des événements clés dans le temps
- Tout comme les graphiques en ligne standards, elle est utile pour l’identification des tendances et la reconnaissance de figures chartistes
- Plus adaptée aux rapports détaillés qu’aux lignes simples
Lignes
- Mettent davantage l'accent sur les figures chartistes que sur les points individuels
- Présentation des données plus fluide
- Plus adaptées aux tableaux de bord que les lignes avec marqueurs
- Peuvent manquer de précision
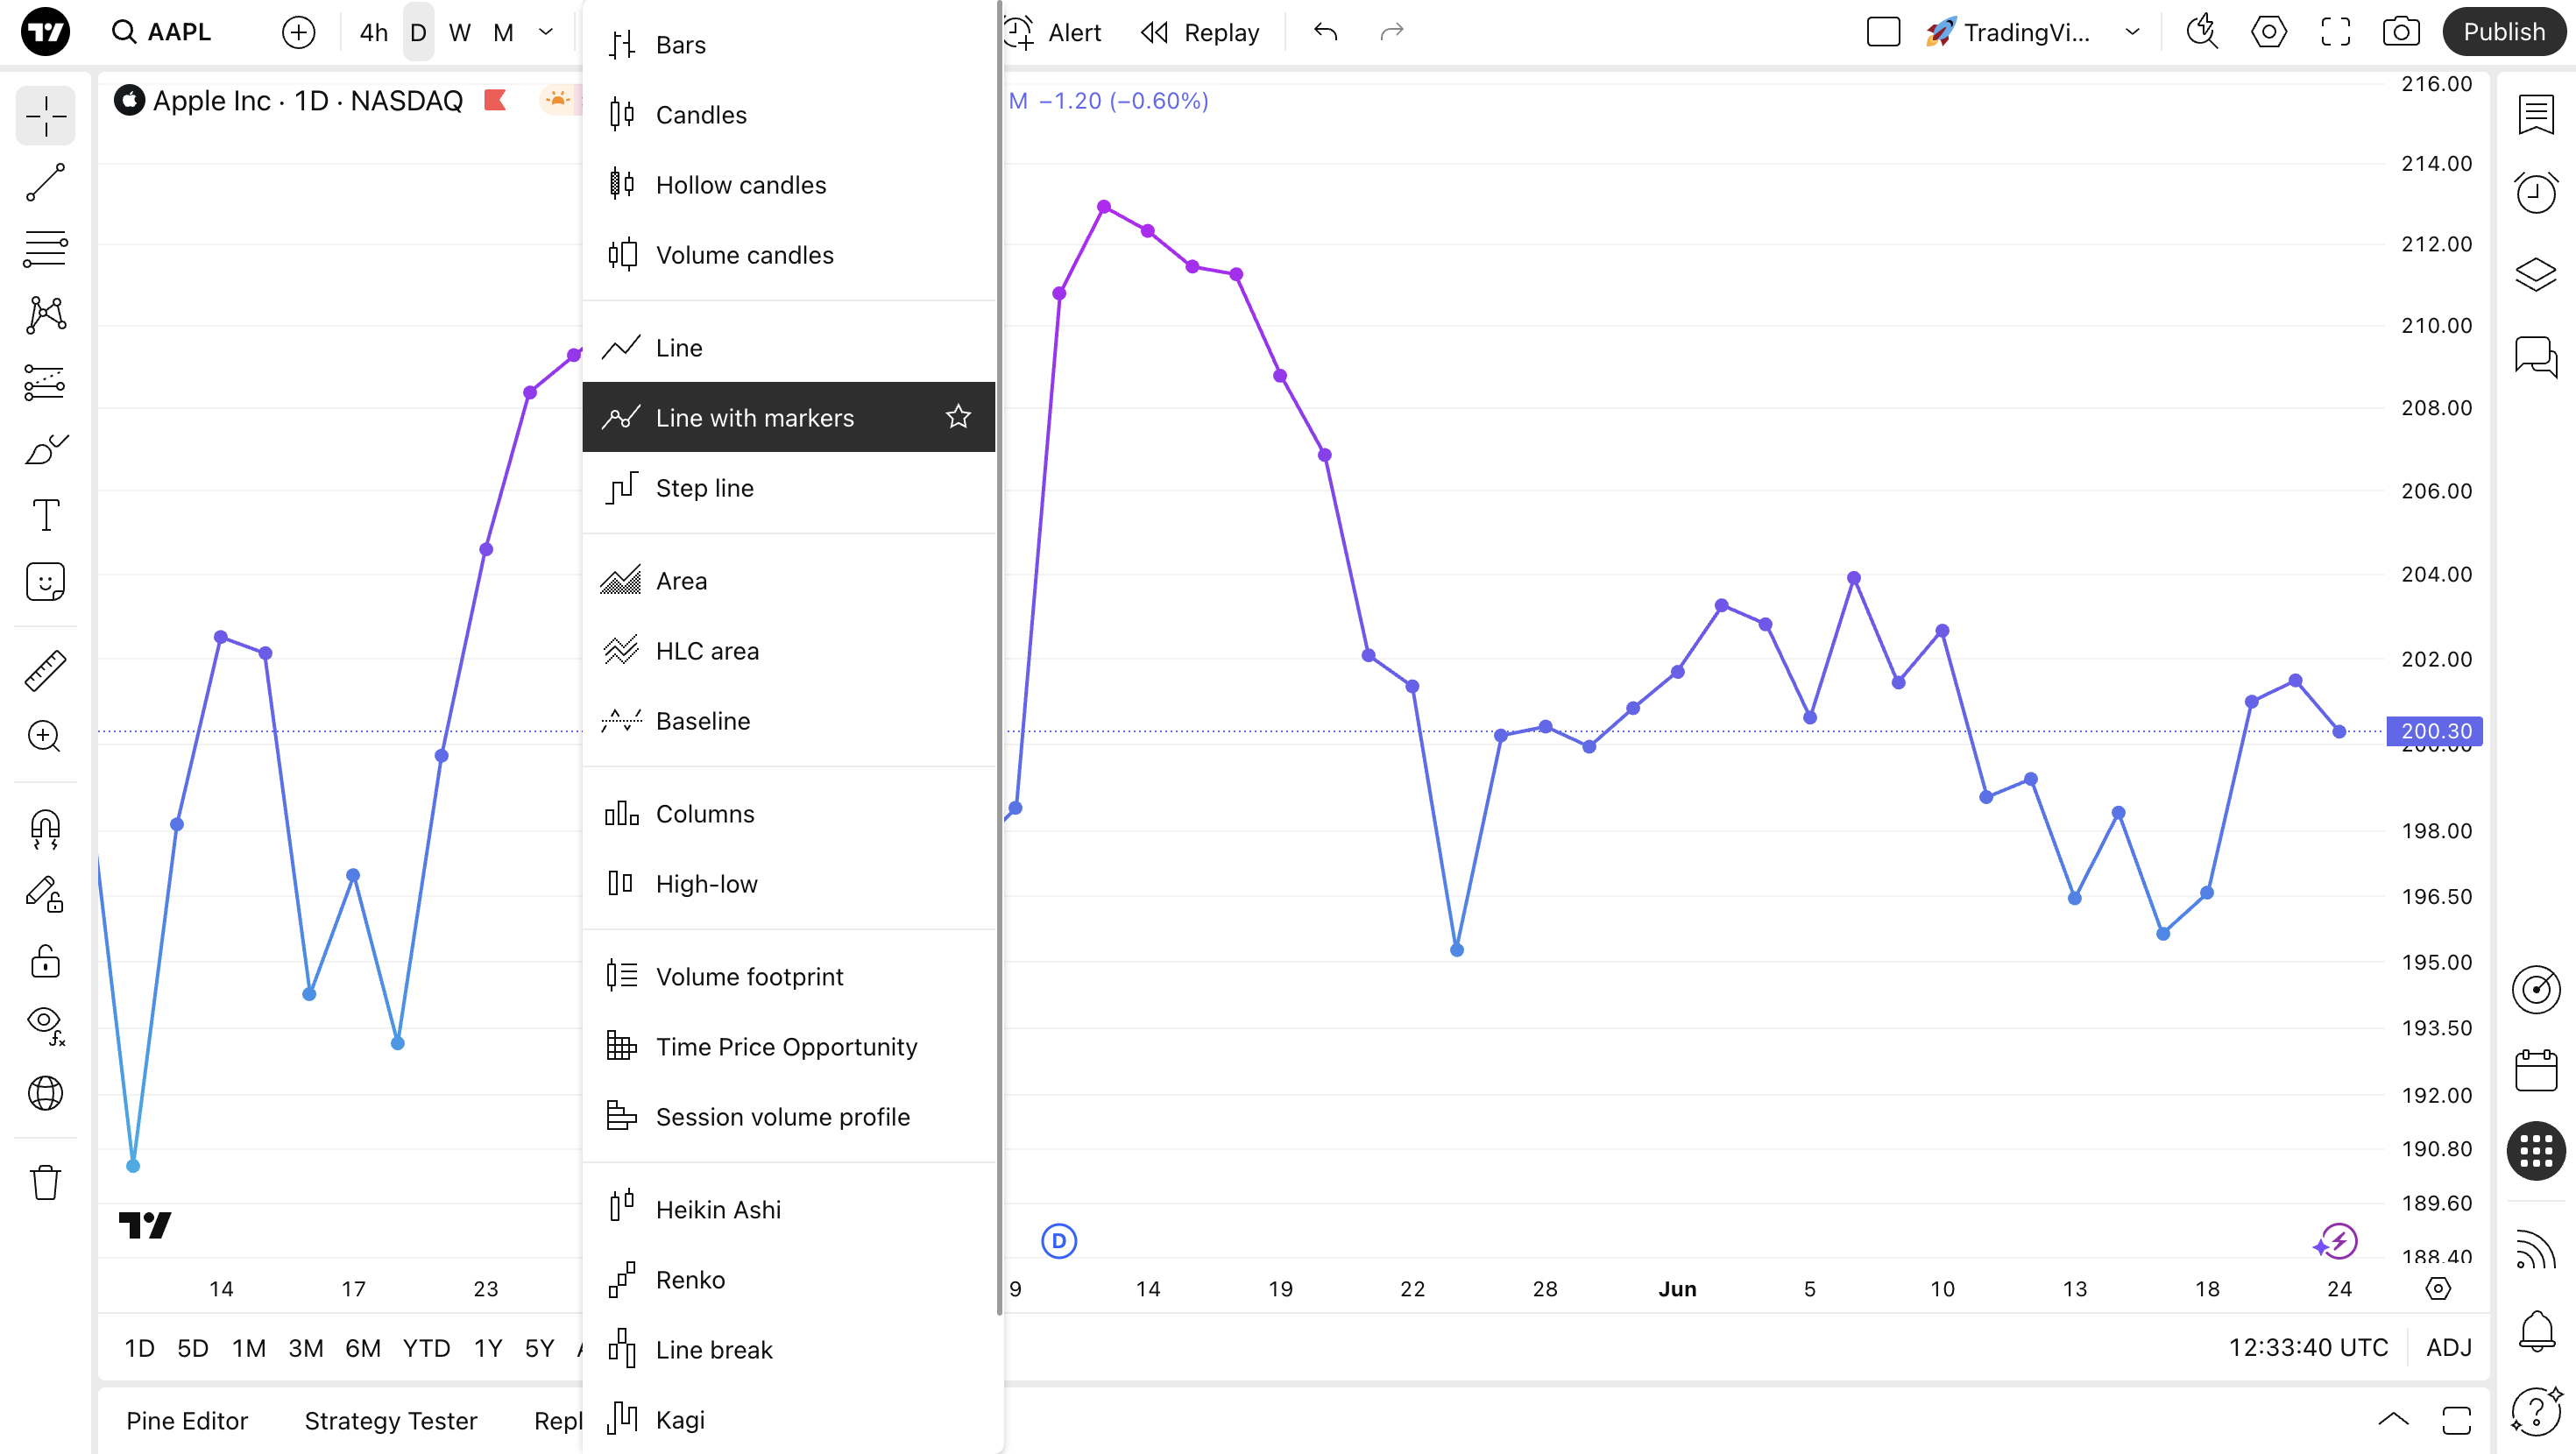
Activer ce type de graphique
Une fois dans Supercharts, ouvrez le menu des types de graphiques dans la barre d’outils supérieure et sélectionnez « Ligne avec marqueurs ».
Paramètres
Les paramètres du graphique en courbes avec marqueurs sont similaires à ceux du graphique en courbes.
Pour ajuster votre graphique en courbes avec marqueurs, trouvez le bouton "Paramètres" en forme de roue dentée dans la barre d'outils supérieure et accédez à l'onglet "Symbole".
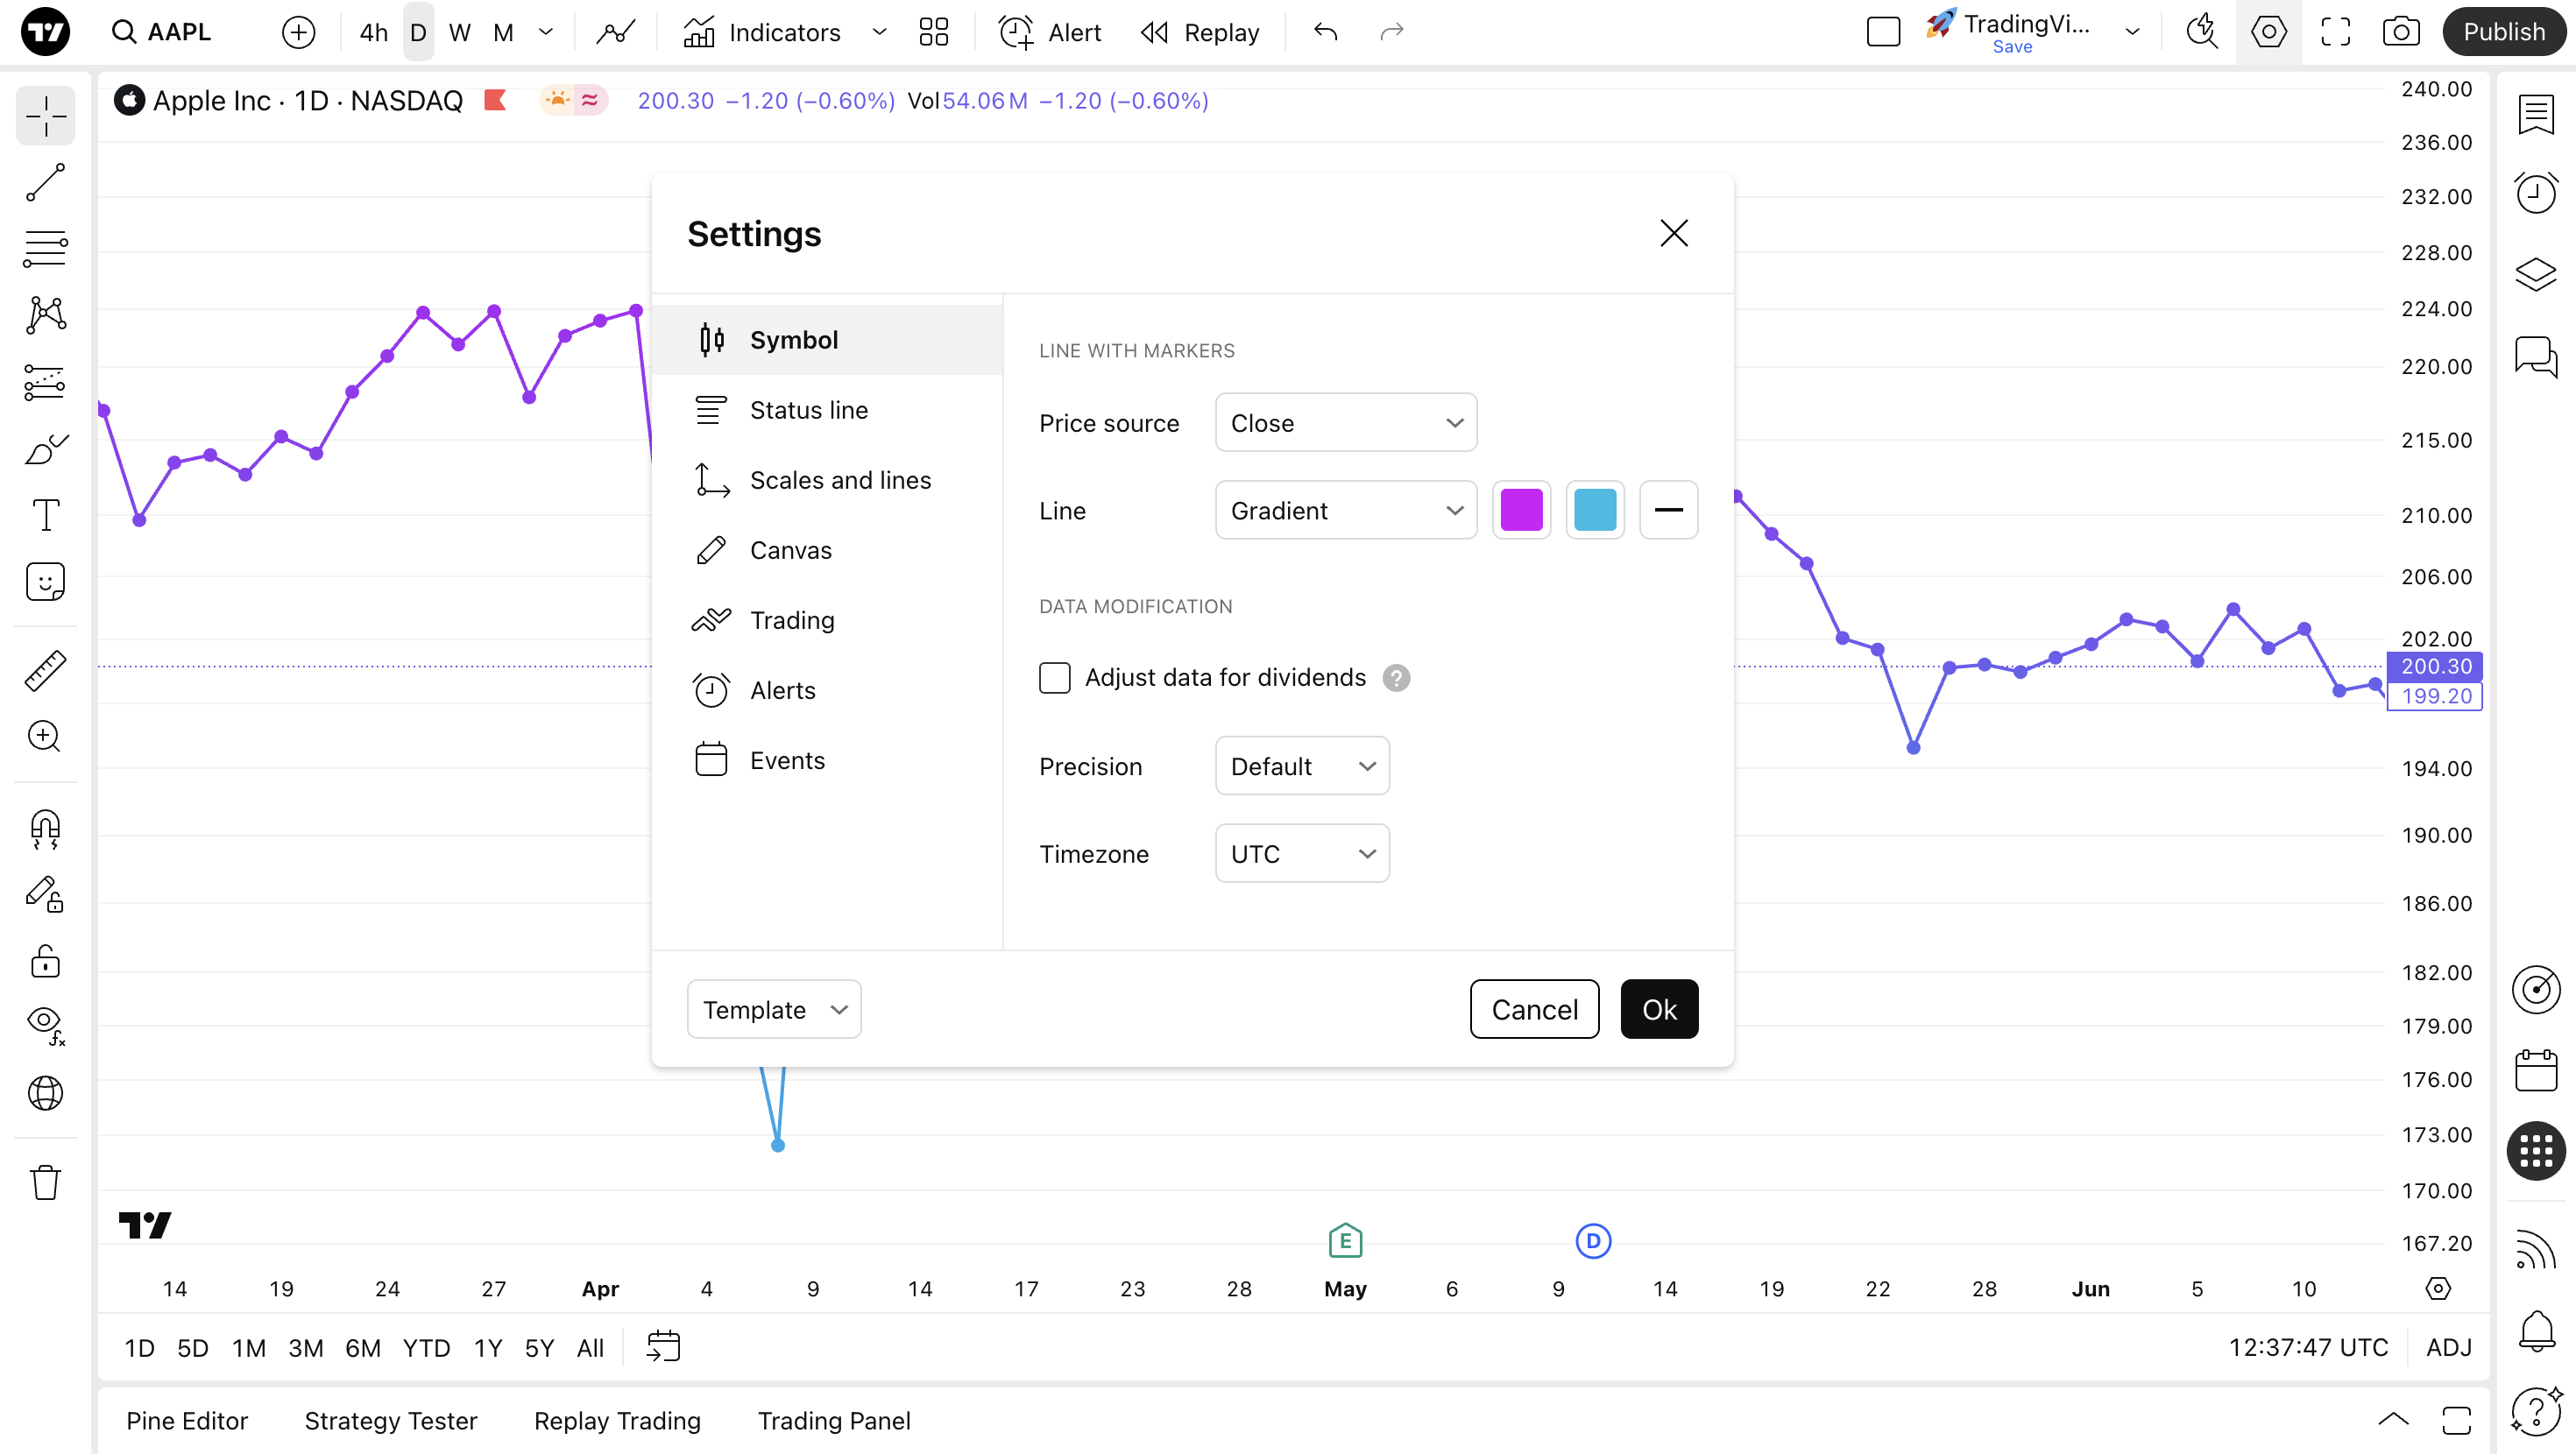
La section Ligne avec marqueurs répertorie les paramètres spécifiques à ce type de graphique :
- Source de prix: Choisissez le prix que vous souhaitez voir apparaître sur le graphique. Par défaut, il est défini sur le prix de clôture, ce qui signifie que le graphique sera formé avec les prix de clôture d’un actif. En fonction de votre style de trading, choisissez le prix souhaité comme marqueur :
- Ouverture : Le graphique affichera les prix d'ouverture
- Haut : Affiche uniquement les prix les plus élevés
- Bas : Affiche uniquement les prix les plus bas
- Clôture : Affiche uniquement les prix de clôture
- (H + B)/2 : Affiche la moyenne des prix les plus hauts et les plus bas
- (H + B + C)/3 : Affiche la moyenne des prix les plus hauts, les plus bas et de clôture
- (O + H + B + C)/4 : Affiche la moyenne des prix d'ouverture, les plus hauts, les plus bas et de clôture
Ligne : Avec ce paramètre activé, la couleur de la ligne, son épaisseur et son opacité peuvent être modifiées selon vos préférences. Vous pouvez également choisir entre un dégradé et une ligne pleine.
Ligne avec marqueurs en résumé
Vous pouvez utiliser ce type de graphique si vous souhaitez mettre en évidence des points de données. Nos graphiques ligne avec marqueurs masquent les marqueurs lorsque vous effectuez un zoom arrière, afin qu'ils ne vous distraient pas pendant votre analyse.
Ils fonctionnent avec tous les modèles de graphiques, et peuvent être utilisés pour la reconnaissance de tendances ainsi que comme lignes standards.