OPEN-SOURCE SCRIPT
Zero-lag Volatility-Breakout EMA Trend Strategy
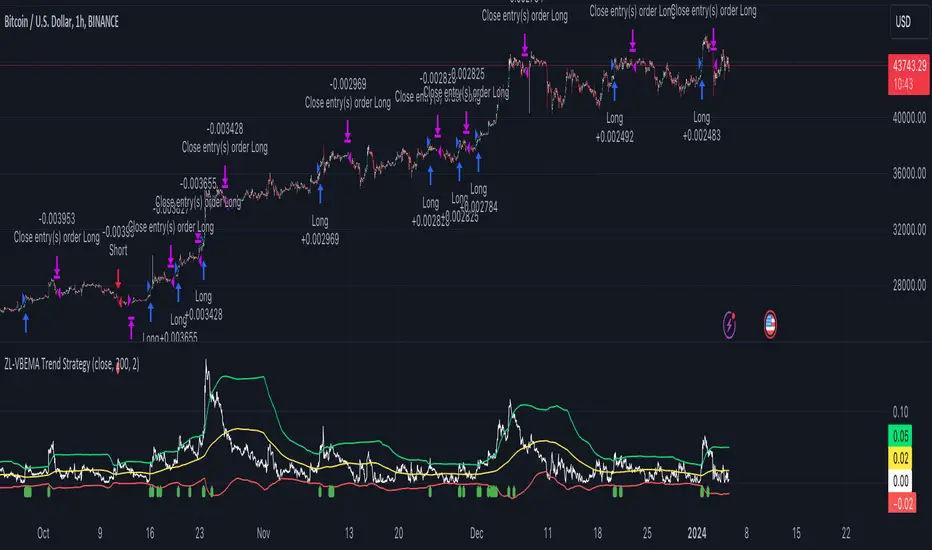
This is a simple volatility-breakout strategy which uses the difference in two different zero-lag* EMAs (explained below on what exactly I mean by this) to track the upwards or downwards strength of an instrument. When the difference breaks above a Bollinger Band of a configurable standard deviation multiple, the strategy enters based off the direction of the base EMA used (i.e. if the difference breaks above and the current EMA is rising, a long entry is produced. If the difference breaks above and the current EMA is falling, a short entry is produced).
The two EMA-type metrics used to calculate the volatility difference are calculated by the following formula:
This produces a difference which responds immediately to large price movements, instead of lagging if it used strictly the EMA itself.
SETTINGS
Source: The source of the strategy - close, hlc3, another indicator plot, etc.
EMA Difference Length: The length of both the EMA difference statistics and the base EMA used to calculate the entry side.
Standard Deviation Multiple: The Bollinger Bands multiple used when the difference is breaking out.
Use Binary Strategy: The strategy has two configurations: Binary and Rapid-Exit. 'Binary' means that it will not close a long position until a short position is generated, and vice-versa. 'Rapid-Exit' will close a long or short position once the difference reaches the middle Bollinger Band MA. This means that turning on 'Binary' will expose you to more market risk, but potentially greater market return. Turning off 'Binary' will exit quickly and reduce drawdown.
The strategy results below use 10% equity and 0.1% fees per trade.
Script open-source
Dans le plus pur esprit TradingView, l'auteur de ce script l'a publié en open-source, afin que les traders puissent le comprendre et le vérifier. Bravo à l'auteur! Vous pouvez l'utiliser gratuitement, mais la réutilisation de ce code dans une publication est régie par nos Règles. Vous pouvez le mettre en favori pour l'utiliser sur un graphique.
FAQ: I am gradually phasing out my Patreon because of the time it takes to maintain.
BTC: 35PdMMMXFCvPjXKwn8wsRFNwMEPgStaKUJ
Test my strategies on CryptoRobotics: cryptorobotics.co/?trade=f23b09
BTC: 35PdMMMXFCvPjXKwn8wsRFNwMEPgStaKUJ
Test my strategies on CryptoRobotics: cryptorobotics.co/?trade=f23b09
Clause de non-responsabilité
Les informations et les publications ne sont pas destinées à être, et ne constituent pas, des conseils ou des recommandations en matière de finance, d'investissement, de trading ou d'autres types de conseils fournis ou approuvés par TradingView. Pour en savoir plus, consultez les Conditions d'utilisation.