OPEN-SOURCE SCRIPT
UCS_Cycle
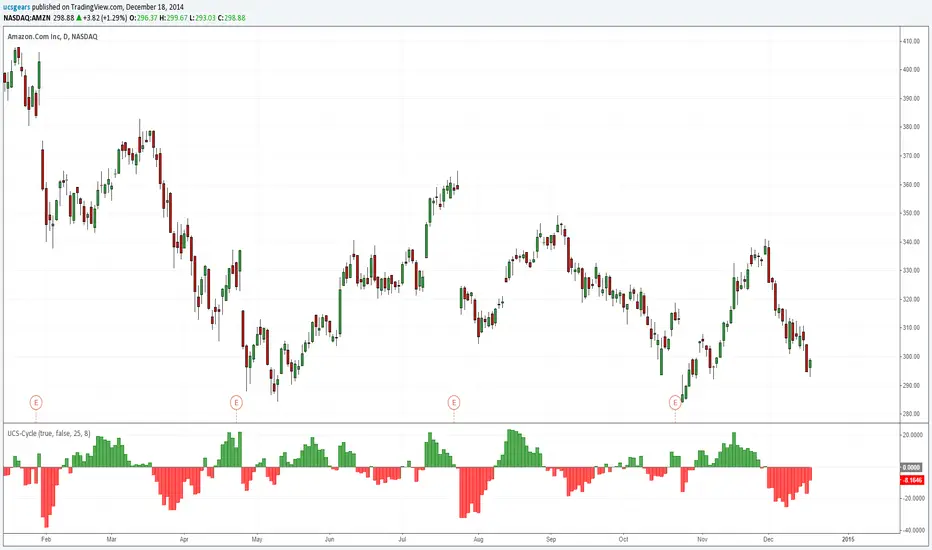
This indicator was designed to remove trend from price and make it easier to identify cycles.
Although this indicator has similarities to MACD. It is better used to identify the cycle of High and Lows based on the Statistical Data (Default is set to 25).
**** DO NOT USE THIS AS A MOMENTUM INDICATOR ****
Although this indicator has similarities to MACD. It is better used to identify the cycle of High and Lows based on the Statistical Data (Default is set to 25).
**** DO NOT USE THIS AS A MOMENTUM INDICATOR ****
Script open-source
Dans l'esprit de TradingView, le créateur de ce script l'a rendu open-source, afin que les traders puissent examiner et vérifier sa fonctionnalité. Bravo à l'auteur! Vous pouvez l'utiliser gratuitement, mais n'oubliez pas que la republication du code est soumise à nos Règles.
Uday C Santhakumar
Clause de non-responsabilité
Les informations et les publications ne sont pas destinées à être, et ne constituent pas, des conseils ou des recommandations en matière de finance, d'investissement, de trading ou d'autres types de conseils fournis ou approuvés par TradingView. Pour en savoir plus, consultez les Conditions d'utilisation.