OPEN-SOURCE SCRIPT
Automatic Fibonacci
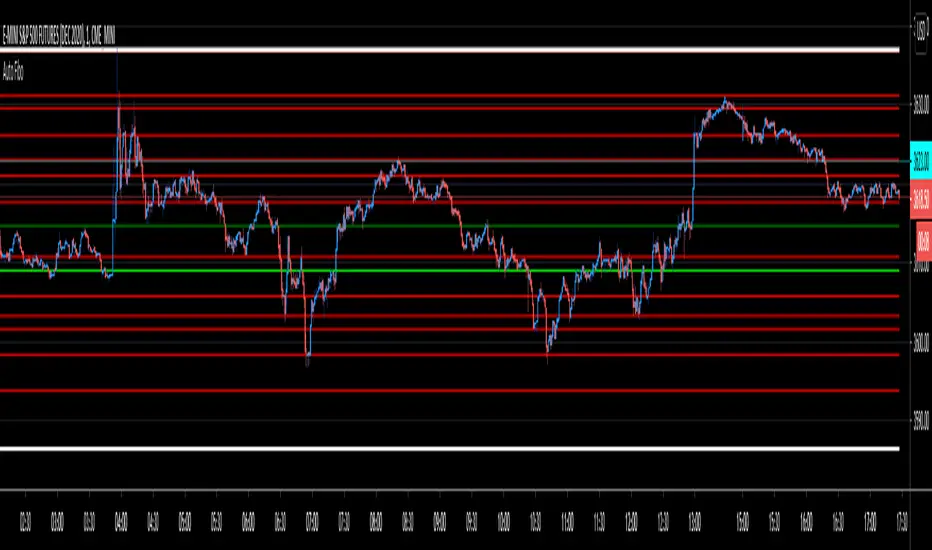
Fibonacci retracements are popular among technical traders. In technical analysis, a Fibonacci retracement is created by taking two extreme points (usually a peak and a trough) on a stock chart and dividing the vertical distance by the key Fibonacci ratios of 23.6%, 38.2%, 50%, 61.8%, and 100%. Basic fibo levels are often known to be 14.6%, 23.6%, 38.2%, 50%, 61.8%, 76.4%, 88.6% and 100%.
This indicator will draw the fibonacci levels automatically. Once these levels are identified, horizontal lines are drawn and used to identify possible support and resistance levels including zones. The fibo levels on this indicator gives you the option to use basic fibo or new paradigm fibo levels. New paradigm fibo levels may be new to most traders, however, the application of new paradigm fibo does allow one to trade with least risk due to the precision of the price action surrounding the fibo levels and zones.
One of the most efficient and great ways to apply this auto fibo indicator and the new paradigm fibo is by only leaving the fibo levels that do have hits and un-selecting the fibo levels that do not have any. You can further remove any other levels so you can trade the zones that these fibo levels create.
In addition, you can also switch the timeframe of the fibo from 1D to different number of days to 1W.
Script open-source
Dans le plus pur esprit TradingView, l'auteur de ce script l'a publié en open-source, afin que les traders puissent le comprendre et le vérifier. Bravo à l'auteur! Vous pouvez l'utiliser gratuitement, mais la réutilisation de ce code dans une publication est régie par nos Règles. Vous pouvez le mettre en favori pour l'utiliser sur un graphique.
Clause de non-responsabilité
Les informations et les publications ne sont pas destinées à être, et ne constituent pas, des conseils ou des recommandations en matière de finance, d'investissement, de trading ou d'autres types de conseils fournis ou approuvés par TradingView. Pour en savoir plus, consultez les Conditions d'utilisation.