PROTECTED SOURCE SCRIPT
ADX by GTC
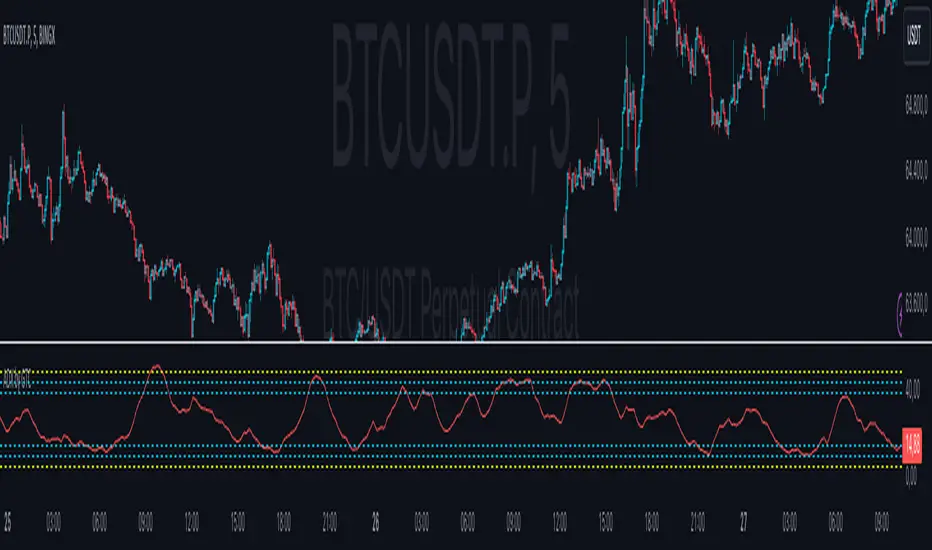
ADX with 6 configurable lines
Average Directional Index (ADX)
Definition
The Average Directional Index (ADX) is a specific indicator used by technical analysts and traders to determine the strength of a trend. The trend can be either bullish or bearish, which is shown by two indicators that often accompany the ADX, the positive directional indicator, commonly known as +DI, and the negative directional indicator, also known as -DI. For this reason, the Average Directional Index is presented with three separate lines, which symbolize each indicator. Each line is used to help evaluate a trade and whether it should be taken long or short, if at all. The ADX indicator on TradingView does not show the +DI and -DI lines by itself, but you can use the Directional Movement Index (DMI) indicator to view all three at the same time.
History
The Average Directional Index was initially designed by Welles Wilder for daily commodity charts, but was later modified so that it could be used in other markets and for various time frames. These modifications allowed the ADX to become what it is today: an indicator for tracking the strength of market trends and analyzing those trends with the help of additional directional indicators.
Calculations
Due to the fact that the Average Directional Index includes multiple lines, the indicator requires a sequence of calculations, which are outlined below.
Start by calculating the +DM, -DM, and True Range (TR) for each period you are analyzing. Please note:
+DM = Current High - Previous High
-DM = Previous Low - Current Low
You can use +DM when Current High - Previous High > Previous Low - Current Low.
Use -DM when Previous Low - Current Low > Current High - Previous High.
The TR is the largest of the following values: Current High - Current Low, Current High - Previous Close, or Current Low - Previous Close.
Go ahead and smooth your +DM, -DM, and TR period averages. Then plug in the -DM and +DM values to calculate the smoothed averages of them.
First xTR = Sum of first x TR readings (x = number of...)
Next xTR value = First xTR - (Previous xTR/14) + Current TR
Next, divide the smoothed +DM value by the smoothed TR value to get your +DI value. Multiply this value by 100.
Divide the smoothed -DM value by the smoothed TR value to get your -DI value. Multiply this value by 100.
The formula for the Directional Movement Index (DX) is +DI minus -DI, then divided by the sum of +DI and -DI (these are all absolute values). Multiply this value by 100.
To get the ADX, you will need to keep calculating the DX values for x periods. Smooth the results over the periods to get your ADX value.
First ADX = the sum of x periods of DX / x
Lastly, ADX = ((Previous ADX * 13) + Current DX) / x
Conclusions and what to look for
The Average Directional Index (ADX), as well as the Negative (-DI) / Positive (+DI) Directional Indicators, are momentum indicators and help investors determine the strength of a trend and the direction of the trend...
The Average Directional Index projects the market price and is clearly seen when prices are rising (when +DI is above -DI), and when prices are falling (when -DI is above +DI). When there are crossovers between the +DI and -DI lines, it can mean potential trading signals as a bearish or bullish market is emerging.
A trend shows the most strength when the Average Directional Index is above 25 (potential buy signal), and a trend is weak or the price is considered trendless if the ADX is below 20, according to the creator of the concept, Wilder. Thought, if the ADX is below 20, it may not be the most suitable time to enter a trade.
If the market presents itself as not following a particular trend, this does not mean that the price is not moving, but it could be making a change or that the direction is not present at that moment.
Limitations
Crossovers between the lines of the indicators can occur quite frequently. In the event that this occurs too frequently, there is most likely to be confusion among traders and the potential for losing money can be high. These moments in question are known as "false signals" and are more frequent when the ADX is calculated below 25.
The Average Directional Index should be combined with other indicators that examine price and with others that can help filter signals and control risk to get the most out of the tool. Like most indicators, it works best when combined with well-functioning data processors and other analytical tools.
Summary
In short, the Average Directional Index
Script protégé
Ce script est publié en source fermée. Cependant, vous pouvez l'utiliser librement et sans aucune restriction – pour en savoir plus, cliquez ici.
Clause de non-responsabilité
Les informations et publications ne sont pas destinées à être, et ne constituent pas, des conseils ou recommandations financiers, d'investissement, de trading ou autres fournis ou approuvés par TradingView. Pour en savoir plus, consultez les Conditions d'utilisation.