PROTECTED SOURCE SCRIPT
B&W HEATMAP
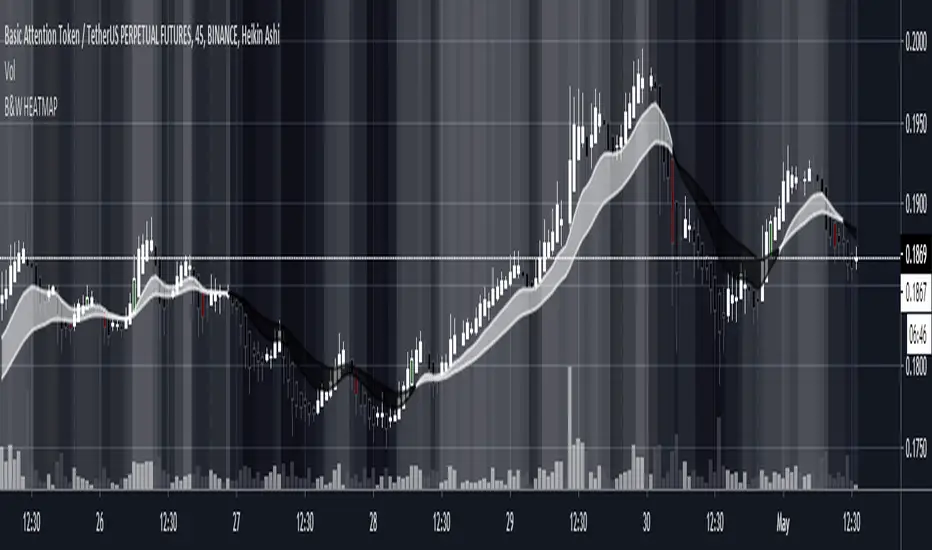
A Black and white heatmap (you can change to any colors in settings) overlay for better trend analysis. Use the crossovers to determine directional bias. Can be used with any other MA cross, baseline, or trendline strategies to help decide if a trade is worth taking. The gradient from black to white represent the strength of the trend . Black = Downtrend, White = Uptrend, Gray=range/chop. Candle colors indicate potential Long/Short
Script protégé
Ce script est publié en source fermée. Cependant, vous pouvez l'utiliser librement et sans aucune restriction – pour en savoir plus, cliquez ici.
Clause de non-responsabilité
Les informations et publications ne sont pas destinées à être, et ne constituent pas, des conseils ou recommandations financiers, d'investissement, de trading ou autres fournis ou approuvés par TradingView. Pour en savoir plus, consultez les Conditions d'utilisation.