PROTECTED SOURCE SCRIPT
3x Linear Regression
Mis à jour
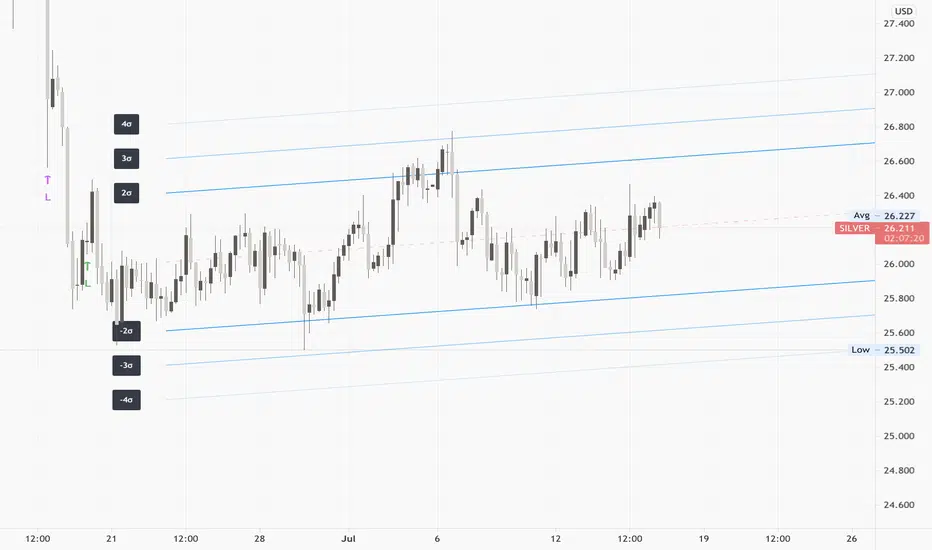
3x Linear Regression indicator.
You should be familiar with the concept of Standard Deviation to properly interpreter this indicator. The main concept is that price likes to stay at the mean and returns to the mean when it has deviated.
I would also advice to look up Mean Regression theory.
Indicator can be used on all timeframes. I would advice to always look at HTF so you know the bigger picture.
Find the start of a range and change the period of this indicator so it starts at that point in time.
- Using the inputs you can define your deviation levels.
- You can turn on labels to show the sigma next to each line
You should be familiar with the concept of Standard Deviation to properly interpreter this indicator. The main concept is that price likes to stay at the mean and returns to the mean when it has deviated.
I would also advice to look up Mean Regression theory.
Indicator can be used on all timeframes. I would advice to always look at HTF so you know the bigger picture.
Find the start of a range and change the period of this indicator so it starts at that point in time.
Notes de version
Updated chartNotes de version
- Updated chartNotes de version
- Added functionality to define the start of a range so that 3x Lin Reg automatically calculates the period. It will adds new bars to the datapool, instead of having a fixed length/periodNotes de version
- Defined max_bars_backNotes de version
update study nameif u appreciate my work, buy me a cookie
usdt trc20 TSUTzbvtaQU395SJmZBz4tiQ2WC31uUEAF
usdt trc20 TSUTzbvtaQU395SJmZBz4tiQ2WC31uUEAF
Clause de non-responsabilité
Les informations et les publications ne sont pas destinées à être, et ne constituent pas, des conseils ou des recommandations en matière de finance, d'investissement, de trading ou d'autres types de conseils fournis ou approuvés par TradingView. Pour en savoir plus, consultez les Conditions d'utilisation.