OPEN-SOURCE SCRIPT
Elliott Wave 3 Finder
Mis à jour
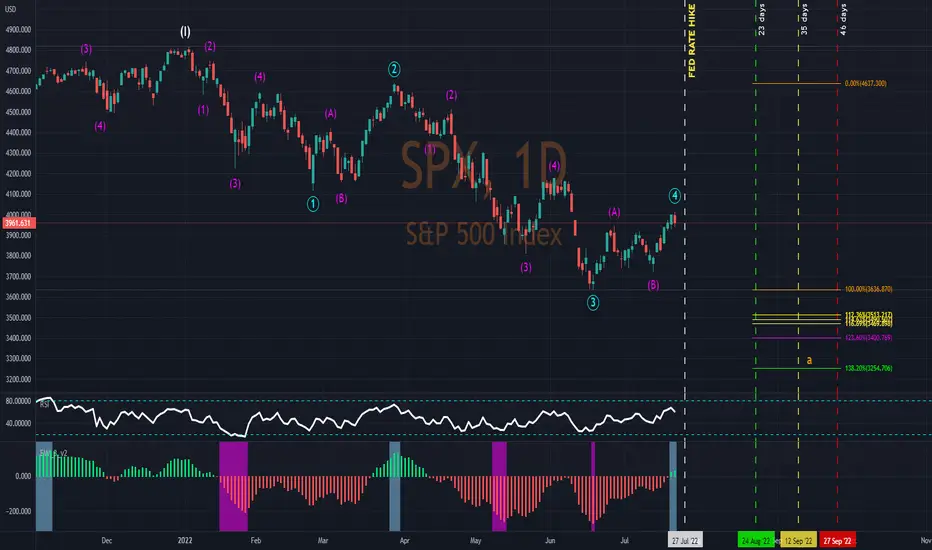
This script will attempt to find the location of the third wave in the Elliot Wave Theory. The bars will become highlighted when possible wave 3 criteria is met. Multiple bars in a row may have a painted background. The point at which the bars are no longer painted will potentially be at or near the end of wave 3.
The background paints a baby blue for wave 3s in an overall uptrend, and pink for downtrends.
The background paints a baby blue for wave 3s in an overall uptrend, and pink for downtrends.
Notes de version
I have provide a user input to change how many bars are considered for painting extreme highs and lows. The default is 50 bars which means if the current bar is the highest high in the last 50 bars it will receive a painted background. Same applies for the low. Alter this setting to see the differences in sensitivity.Script open-source
Dans le plus pur esprit TradingView, l'auteur de ce script l'a publié en open-source, afin que les traders puissent le comprendre et le vérifier. Bravo à l'auteur! Vous pouvez l'utiliser gratuitement, mais la réutilisation de ce code dans une publication est régie par nos Règles. Vous pouvez le mettre en favori pour l'utiliser sur un graphique.
Vous voulez utiliser ce script sur un graphique ?
All forecasts are based on analysis of past behavior. Prior movements are not always indicative of future movement. Develop the theory, test the theory. Do your own research. Nothing in this analysis constitutes advice. YouTube For More. Good luck!!
Clause de non-responsabilité
Les informations et les publications ne sont pas destinées à être, et ne constituent pas, des conseils ou des recommandations en matière de finance, d'investissement, de trading ou d'autres types de conseils fournis ou approuvés par TradingView. Pour en savoir plus, consultez les Conditions d'utilisation.