OPEN-SOURCE SCRIPT
Faytterro Oscillator
Mis à jour
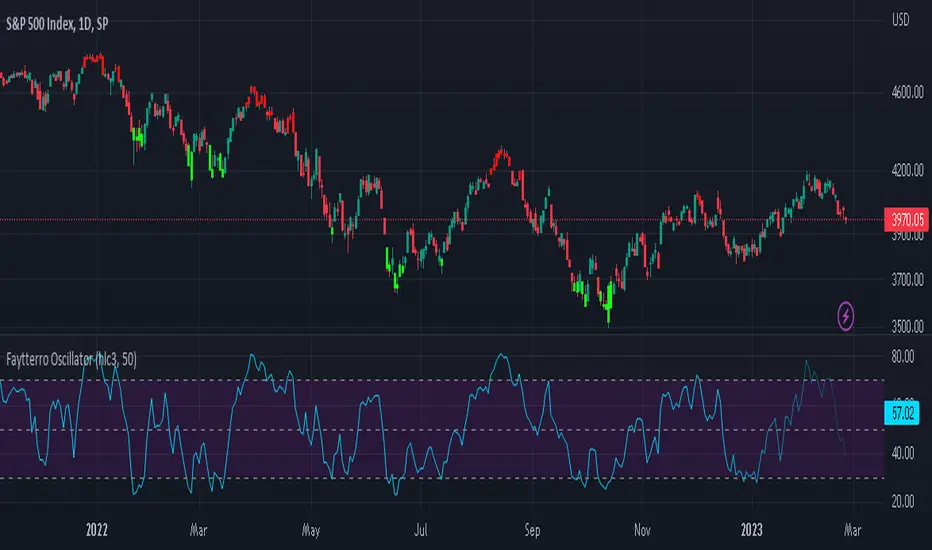
what is Faytterro oscillator?
An oscillator that perfectly identifies overbought and oversold zones.
what it does?
this places the price between 0 and 100 perfectly but with a little delay. To eliminate this delay, it predicts the price to come, and the indicator becomes clearer as the probability of its prediction increases.
how it does it?
This indicator is obtained with "faytterro bands", another indicator I designed. For more information about faytterro bands:
A kind of stochastic function is applied to the faytterro bands indicator, and then another transformation formula that I have designed and explained in detail in the link above is applied. These formulas are also applied again to calculate the prediction parts.
how to use it?
Use this indicator to see past overbought and oversold zones and to see future ones.
The input named source is used to change the source of the indicator.
The length serves to change the signal frequency of the indicator.
Notes de version
alert added.Notes de version
warning addedNotes de version
added color and line size changes.Notes de version
Fixed the label on scala.barcolor removed, bgcolor added.
Script open-source
Dans le plus pur esprit TradingView, l'auteur de ce script l'a publié en open-source, afin que les traders puissent le comprendre et le vérifier. Bravo à l'auteur! Vous pouvez l'utiliser gratuitement, mais la réutilisation de ce code dans une publication est régie par nos Règles. Vous pouvez le mettre en favori pour l'utiliser sur un graphique.
Clause de non-responsabilité
Les informations et les publications ne sont pas destinées à être, et ne constituent pas, des conseils ou des recommandations en matière de finance, d'investissement, de trading ou d'autres types de conseils fournis ou approuvés par TradingView. Pour en savoir plus, consultez les Conditions d'utilisation.