OPEN-SOURCE SCRIPT
WhenWasThePriceAction
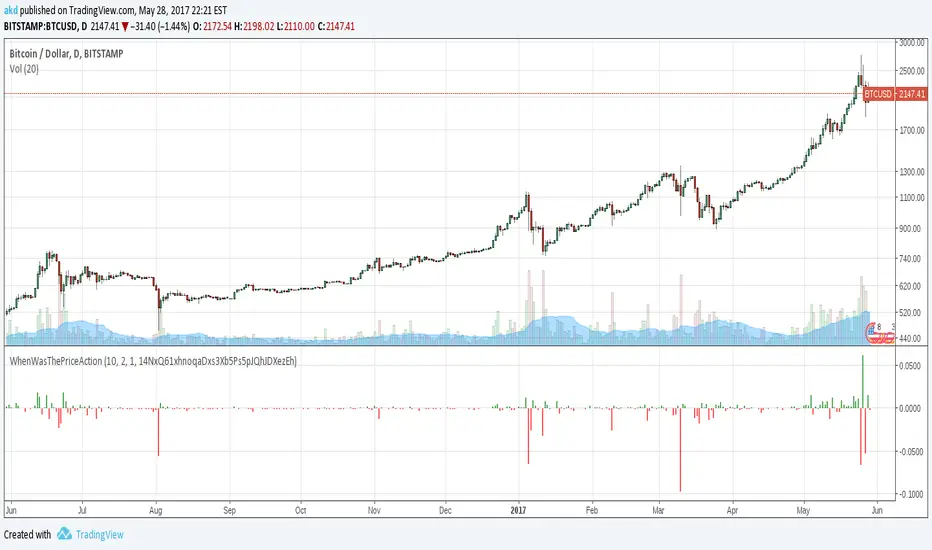
Bars of largest range (volatility)
* see moments of strongest price action immediately
* colored & upDown by candle color
* amplifier: you see only the bull runs, and subsequent dumps
Very nice on the 5 years scale of BITSTAMP:BTCUSD - nothing comparable to 2013 has happened yet.
Internals:
squared_range = pow(high-low, 2)
That is essentially it already. The rest are details:
* gauge with (in case of Bitcoin exponentially rising) price
* show in red for negative candles
* take even higher polynomial (than 2) to show only the very largest values
* allow some user input (but there is not much more that can be chosen here.)
Sorry for such a simple formula - but sometimes the easiest things are powerful.
Please give feedback. tradingview.com/u/akd and/or in the cryptocurrency chat. Thanks.
Script open-source
Dans le plus pur esprit TradingView, l'auteur de ce script l'a publié en open-source, afin que les traders puissent le comprendre et le vérifier. Bravo à l'auteur! Vous pouvez l'utiliser gratuitement, mais la réutilisation de ce code dans une publication est régie par nos Règles. Vous pouvez le mettre en favori pour l'utiliser sur un graphique.
Clause de non-responsabilité
Les informations et les publications ne sont pas destinées à être, et ne constituent pas, des conseils ou des recommandations en matière de finance, d'investissement, de trading ou d'autres types de conseils fournis ou approuvés par TradingView. Pour en savoir plus, consultez les Conditions d'utilisation.