OPEN-SOURCE SCRIPT
NEXT BAR Percentages
Mis à jour
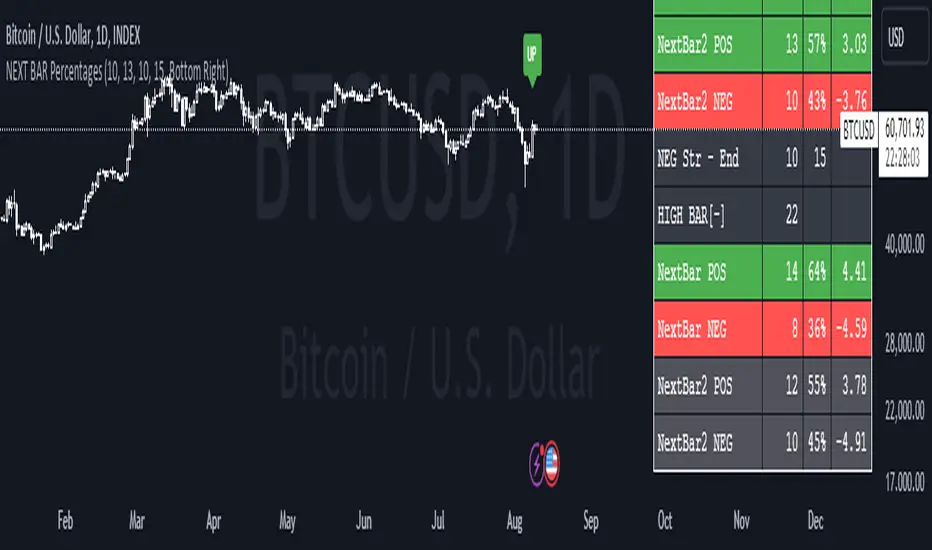
NEXT BAR Percentages Indicator
This Pine Script code implements the "NEXT BAR Percentages" indicator, designed to analyze and display percentage changes between consecutive bars on a TradingView chart. The script provides valuable insights into how percentage changes in price behave after significant price movements, aiding traders in identifying potential trends or reversals.
Key Features:
Percentage Change Calculations:
Close-to-Close: Calculates the percentage change between the close of the current bar and the close of the previous bar.
High-to-Close: Calculates the percentage change between the high of the current bar and the close of the previous bar.
Low-to-Close: Calculates the percentage change between the low of the current bar and the close of the previous bar.
High-to-Close (Wick): Computes the percentage change from the close to the high of the current bar.
Low-to-Close (Wick): Computes the percentage change from the close to the low of the current bar.
Dynamic Table Display:
Creates a table on the chart to display various statistics related to percentage changes.
The table position is customizable, with options including "Top Left," "Middle Left," "Bottom Left," "Top Right," "Middle Right," "Bottom Right," "Top Center," "Middle Center," and "Bottom Center."
Count and Average Calculations:
High POS/NEG Counts: Counts occurrences of significant positive and negative percentage changes based on user-defined thresholds.
High POS/NEG Average: Computes the average percentage change following high positive and negative percentage changes.
Next Bar Statistics: Provides statistics on the percentage change of the next bar following identified significant price movements.
Visual Indicators:
Labels: Plots arrows on the chart when a high positive or high negative percentage change is detected, visually highlighting these events.
Customizable Input Parameters:
Adjust the thresholds for identifying high positive and negative percentage changes (highpos, highposEnd, highneg, highnegEnd).
Specify the start date for analysis (teststartdate), allowing for focused period analysis.
Usage:
Traders: Gain insights into price behavior following significant movements to make informed trading decisions.
Analysis: Customizable parameters and visual indicators enable detailed analysis of price action and trend identification.
Enhance your chart analysis with this indicator for a clear, data-driven view of percentage changes and their implications for future price movements.
Notes de version
NEXT BAR Percentages IndicatorThis Pine Script code creates the "NEXT BAR Percentages" indicator for TradingView. It helps traders understand what might happen next after big price moves by showing percentage changes and related stats.
Key Features:
Percentage Changes: Shows how much the price changes between bars, including close-to-close and high-to-close.
Dynamic Table: Displays these stats in a customizable table on your chart.
Visual Indicators: Highlights significant price moves with arrows.
Usage:
Traders: Use this indicator to make informed decisions based on statistical probabilities of what happens after large price changes.
Script open-source
Dans le plus pur esprit TradingView, l'auteur de ce script l'a publié en open-source, afin que les traders puissent le comprendre et le vérifier. Bravo à l'auteur! Vous pouvez l'utiliser gratuitement, mais la réutilisation de ce code dans une publication est régie par nos Règles. Vous pouvez le mettre en favori pour l'utiliser sur un graphique.
Vous voulez utiliser ce script sur un graphique ?
Clause de non-responsabilité
Les informations et les publications ne sont pas destinées à être, et ne constituent pas, des conseils ou des recommandations en matière de finance, d'investissement, de trading ou d'autres types de conseils fournis ou approuvés par TradingView. Pour en savoir plus, consultez les Conditions d'utilisation.