OPEN-SOURCE SCRIPT
Price Regression Agreggator
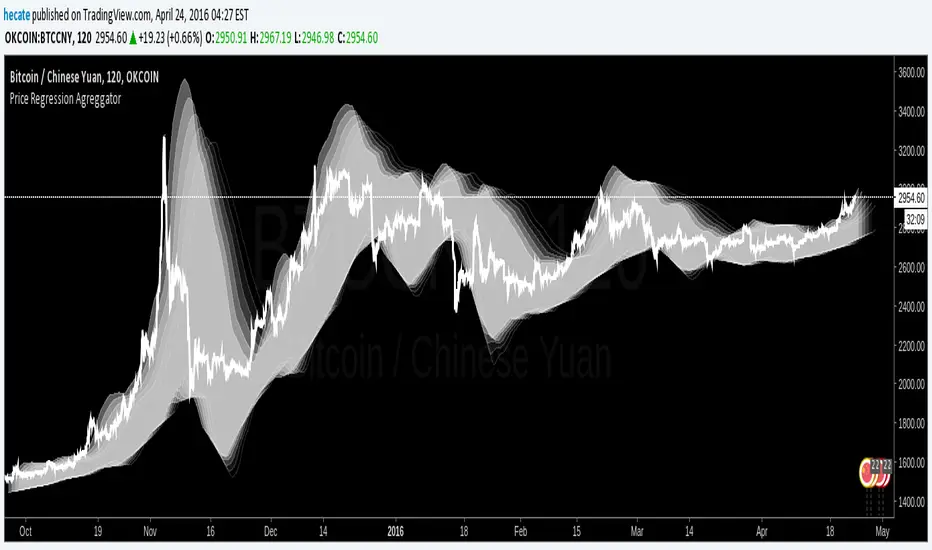
Price Estimator with aggregated linear regresion
---------------------------------------------------------------------------
How it works:
It uses 6 linear regression from time past to get an estimated point in future time, and using transparency, those areas that are move "visited" by those 6 different regressions and maybe more probable to be visited by the price (in fact if you zoom out you will see that price normally is around the lighter zones) have more aggregated painted colors, the transparency is lower and well, the lighter area should be more probable to be visited by the price should we put any faith on linear regression estimations and even more when many of them coincide in several points where the color is more aggregated.
If the "I" (the previous regressions increment) is too low, then we will have huge spikes as the only info gathered from the oldest linear regresssion will be within the very same trend we are now, resulting in "predictions" of huge spikes in the trend direction. (all regressions estimating on a line pointing to infinite)
If the "I" is high enough (not very or TV won't be able to display it) then you will get somewhat a "vectorial" resultant force of many linear regressions giving a more "real prediction" as it comes from tendencies from higher timeframes. E.g. 12 hours could be going down, 4h could be going sideways, 30m could be going up.
contact tradingview -> hecate . The idea and implementation is mine.
Note: transparency + 10 * tranparencygradient cannot be > 100 or nothing will be displayed
Note2: if the Future increment (how many lines are displayed to the right of the actual price ) are excessive, it will start to do weird things.
Note3: two times the standard deviation statistically correponds to a probability of 95%. We are calculating Top and Bot with that amount above and below. So anything inside those limits is more probable and if we are out of those limits it should fall back soon. Increase the number of times the std deviation as desired. There are calculators in the web to translate number of times std dev to their correspondent probability.
Note4: As we use backwards in time linear regressions for our "predictions" we lose responsiveness. Those old linear regressions are weighted with less value than more recent ones.
Note5: In the code i have included many color combinations (some horrible :-) )
Note6: This was an experiment while i was quite bored although ended enjoying playing with it.
Have fun! :-)


I leave it here because i am getting dizzy.

---------------------------------------------------------------------------
How it works:
It uses 6 linear regression from time past to get an estimated point in future time, and using transparency, those areas that are move "visited" by those 6 different regressions and maybe more probable to be visited by the price (in fact if you zoom out you will see that price normally is around the lighter zones) have more aggregated painted colors, the transparency is lower and well, the lighter area should be more probable to be visited by the price should we put any faith on linear regression estimations and even more when many of them coincide in several points where the color is more aggregated.
If the "I" (the previous regressions increment) is too low, then we will have huge spikes as the only info gathered from the oldest linear regresssion will be within the very same trend we are now, resulting in "predictions" of huge spikes in the trend direction. (all regressions estimating on a line pointing to infinite)
If the "I" is high enough (not very or TV won't be able to display it) then you will get somewhat a "vectorial" resultant force of many linear regressions giving a more "real prediction" as it comes from tendencies from higher timeframes. E.g. 12 hours could be going down, 4h could be going sideways, 30m could be going up.
contact tradingview -> hecate . The idea and implementation is mine.
Note: transparency + 10 * tranparencygradient cannot be > 100 or nothing will be displayed
Note2: if the Future increment (how many lines are displayed to the right of the actual price ) are excessive, it will start to do weird things.
Note3: two times the standard deviation statistically correponds to a probability of 95%. We are calculating Top and Bot with that amount above and below. So anything inside those limits is more probable and if we are out of those limits it should fall back soon. Increase the number of times the std deviation as desired. There are calculators in the web to translate number of times std dev to their correspondent probability.
Note4: As we use backwards in time linear regressions for our "predictions" we lose responsiveness. Those old linear regressions are weighted with less value than more recent ones.
Note5: In the code i have included many color combinations (some horrible :-) )
Note6: This was an experiment while i was quite bored although ended enjoying playing with it.
Have fun! :-)
I leave it here because i am getting dizzy.
Script open-source
Dans le plus pur esprit TradingView, l'auteur de ce script l'a publié en open-source, afin que les traders puissent le comprendre et le vérifier. Bravo à l'auteur! Vous pouvez l'utiliser gratuitement, mais la réutilisation de ce code dans une publication est régie par nos Règles. Vous pouvez le mettre en favori pour l'utiliser sur un graphique.
Clause de non-responsabilité
Les informations et les publications ne sont pas destinées à être, et ne constituent pas, des conseils ou des recommandations en matière de finance, d'investissement, de trading ou d'autres types de conseils fournis ou approuvés par TradingView. Pour en savoir plus, consultez les Conditions d'utilisation.