OPEN-SOURCE SCRIPT
Shifted Symbol Overlay with Offset

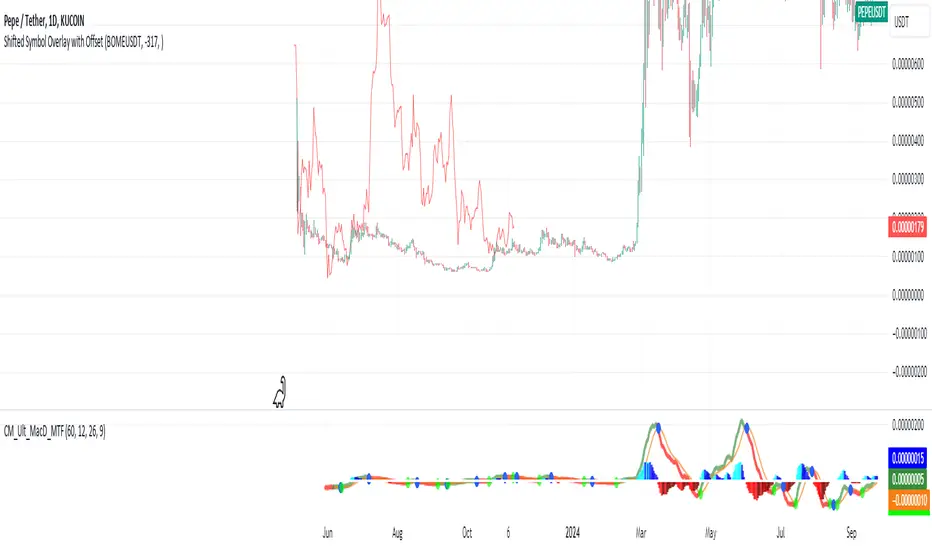
The Shifted Symbol Overlay Indicator is a custom TradingView indicator designed to overlay the price data of one stock or asset over another, allowing for direct visual comparison. This is particularly useful for comparing the performance of two assets over different time periods. The indicator enables you to shift the data from one asset either forward or backward in time, making it easier to compare historical data from one stock with more recent data from another. The indicator supports shifting both to the right (future periods) and to the left (earlier periods), helping traders and analysts explore correlations or divergences between two financial instruments.
The indicator also includes a normalization option that adjusts the scale of the two assets, so you can compare them even if they have vastly different price levels. This is useful when you're interested in relative performance rather than the absolute price values.
The indicator also includes a normalization option that adjusts the scale of the two assets, so you can compare them even if they have vastly different price levels. This is useful when you're interested in relative performance rather than the absolute price values.
Script open-source
Dans l'esprit TradingView, le créateur de ce script l'a rendu open source afin que les traders puissent examiner et vérifier ses fonctionnalités. Bravo à l'auteur! Bien que vous puissiez l'utiliser gratuitement, n'oubliez pas que la republication du code est soumise à nos Règles.
Clause de non-responsabilité
Les informations et publications ne sont pas destinées à être, et ne constituent pas, des conseils ou recommandations financiers, d'investissement, de trading ou autres fournis ou approuvés par TradingView. Pour en savoir plus, consultez les Conditions d'utilisation.