PROTECTED SOURCE SCRIPT
Mis à jour VS TrendXpert Pro
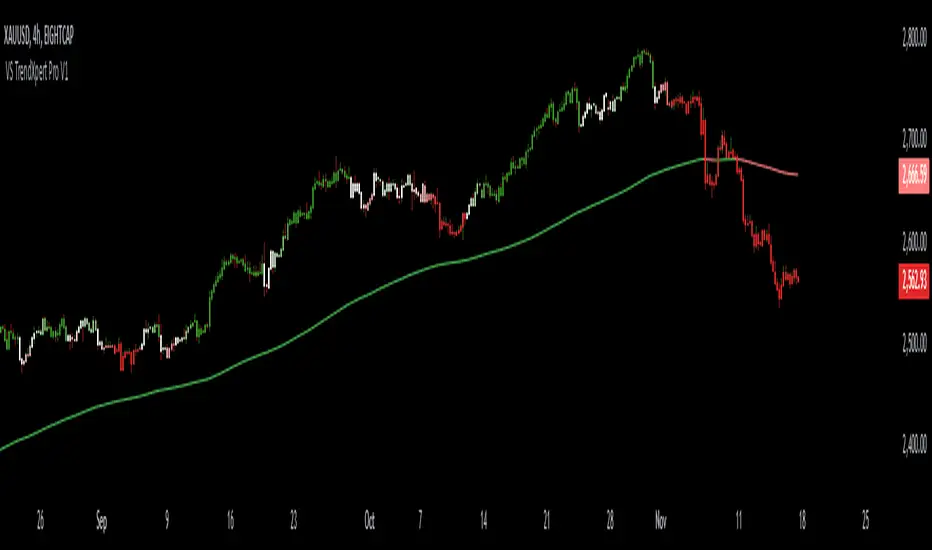
The VS TrendXpert Pro indicator is designed to offer a comprehensive and powerful trading solution by combining trend identification, dynamic candle replication, buy/sell sensitivity signals, and volatility moving averages. This multi-functional tool aids traders in making informed decisions by visualizing trend strength, key price levels, and potential buy/sell opportunities across multiple timeframes and market conditions.
This script is a versatile and easy-to-use tool developed in Pine Script™ (TradingView) to help users identify trends and improve trading accuracy by leveraging advanced gradient color changes, dynamic candle replication, and a sensitivity-based signaling system. The indicator seamlessly blends visual clarity with robust trend analysis, making it suitable for both novice and professional traders.
Indicator Components:
VS Dynamic Trend
VS Dynamic Replicator
VS Sensitivity Buy/Sell
VS Volatile Moving Averages (VMAs)
1. VS Dynamic Trend
Description:
The VS Dynamic Trend component focuses on real-time trend detection by incorporating a gradient coloring system that shifts based on trend strength. This tool enables traders to visually assess the market's bullish or bearish strength using dynamic gradient colors on the chart candles.
What It Does:
Color Gradient Visualization: The candles are colored dynamically to reflect the strength of the trend. The gradient moves from weak to strong in both bullish and bearish conditions.
Gradient Sensitivity: Adjustable sensitivity controls allow traders to modify the color shift intensity, making the indicator responsive to varying market conditions.
How to Use:
Bullish Trend: Candles will gradually change from a neutral color to a strong bullish color (as per the selected gradient).
Bearish Trend: Similarly, in a bearish trend, candles shift from neutral to a strong bearish color.
Neutral Market: If the trend is unclear, candles remain in a neutral color, signaling potential consolidation or indecision.
Inputs:
Gradient Sensitivity: Adjust the responsiveness of the color changes (higher values = less sensitivity).
Toggle Dynamic Gradient: Enable or disable the gradient coloring feature based on user preference.
2. VS Dynamic Replicator
Description:
The VS Dynamic Replicator replicates previous candles based on selected timeframes, projecting the future possible price movements. This component helps users predict price action by visually referencing past price behavior with adjustable offsets and line widths for better readability.
What It Does:
Candle Replication: Recreates a replica of the previous or selected timeframe candle on the chart with full customization of color and size.
Projected Price Levels: Visualizes important price levels (Open, High, Low, Close) with dotted lines extending into the future.
How to Use:
Choose Timeframe: Select the timeframe you want to replicate (e.g., daily, weekly).
Customizable Display: Adjust the offset, candle width, and line thickness to personalize the candle replication display.
Use Labels: Labels display the open, high, low, and close values, helping traders easily recognize critical price levels.
Inputs:
Candle Colors: Customize the colors for bullish and bearish replicated candles.
Timeframe Selection: Select the desired timeframe to replicate past candles.
Offset: Determine how far to project the replicated candle from the current price.
3. VS Sensitivity Buy/Sell
Description:
The VS Sensitivity Buy/Sell module generates buy and sell signals based on the crossover of moving averages. It allows traders to select sensitivity levels to determine the frequency and timing of the signals.
What It Does:
Sensitivity Settings: Offers three sensitivity levels—High, Medium, and Low—to adjust how quickly signals are generated.
Buy/Sell Signals: Signals are plotted as triangles above or below the price, indicating potential entry or exit points.
How to Use:
Adjust Sensitivity: Select High for more frequent signals or Low for fewer but more significant signals.
Monitor Signals: Buy signals are shown as green triangles below bars, while sell signals appear as red triangles above bars.
Inputs:
Sensitivity Levels: Choose between High, Medium, and Low to set the frequency of signals.
Toggle Buy/Sell Signals: Enable or disable the buy and sell signals based on your trading strategy.
4. VS Volatile Moving Averages (VMAs)
Description:
The VS Volatile Moving Averages (VMAs) feature is a set of volatility-adjusted moving averages that reflect market trends with customizable colors. Traders can use VMAs to identify trends across different time horizons (e.g., 20, 50, and 200 periods).
What It Does:
Volatility-Adjusted Averages: Displays three VMAs (20, 50, and 200) that adjust according to market volatility.
Color Coding: Each VMA is color-coded to indicate trend direction (bullish, bearish, or neutral).
Trend Confirmation: The color and slope of the VMAs confirm whether the trend is gaining strength or weakening.
How to Use:
Select VMAs: Choose which moving averages (e.g., VMA 20, 50, 200) to display on the chart.
Color Interpretation: Green indicates a bullish trend, red indicates a bearish trend, and yellow/neutral colors indicate indecision.
Overlay on Chart: The VMAs overlay on your price chart, providing a visual confirmation of trend direction.
Inputs:
Display VMAs: Toggle the display of VMAs on or off.
Adjust Fill Opacity: Modify the transparency of the VMA fill color for clarity on the chart.
Conclusion:
The VS TrendXpert Pro indicator is a robust and customizable tool that combines multiple trading methodologies into one cohesive package. By offering dynamic trend visualization, candle replication, sensitivity-based buy/sell signals, and volatility-driven moving averages, it provides a comprehensive approach to analyzing markets. Suitable for all trader levels, the indicator enhances market insight and helps users make more informed trading decisions.
Notes de version
I removed everything that was making "visual noise" and updated it to the best settings I useScript protégé
Ce script est publié en source fermée. Cependant, vous pouvez l'utiliser librement et sans aucune restriction – pour en savoir plus, cliquez ici.
Clause de non-responsabilité
Les informations et publications ne sont pas destinées à être, et ne constituent pas, des conseils ou recommandations financiers, d'investissement, de trading ou autres fournis ou approuvés par TradingView. Pour en savoir plus, consultez les Conditions d'utilisation.
Script protégé
Ce script est publié en source fermée. Cependant, vous pouvez l'utiliser librement et sans aucune restriction – pour en savoir plus, cliquez ici.
Clause de non-responsabilité
Les informations et publications ne sont pas destinées à être, et ne constituent pas, des conseils ou recommandations financiers, d'investissement, de trading ou autres fournis ou approuvés par TradingView. Pour en savoir plus, consultez les Conditions d'utilisation.