PROTECTED SOURCE SCRIPT
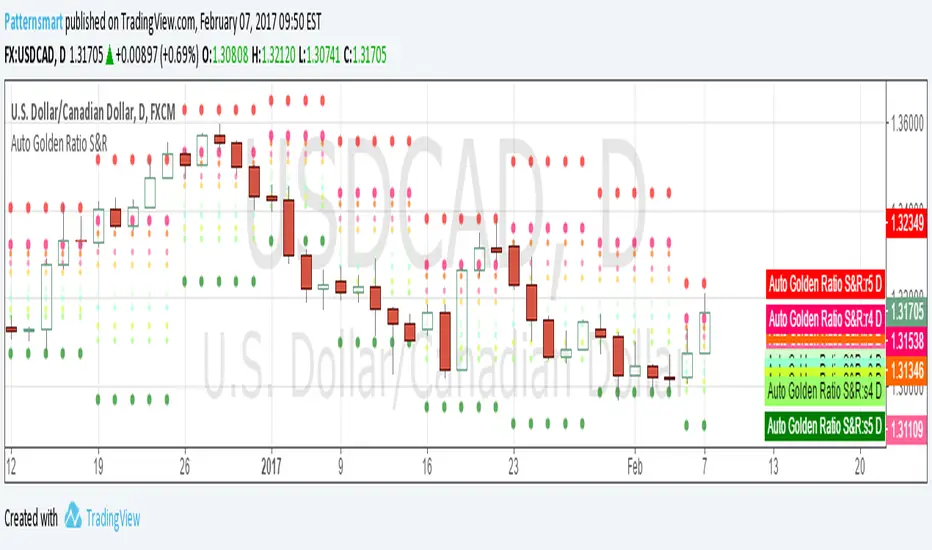
Automatic Golden Ratio Support & Resistance

The golden ratio is also called the golden mean or golden section.
It has been used to analyze the proportions of natural objects as well as man-made systems such as financial markets.
The mathematics of the golden ratio and of the Fibonacci sequence is intimately interconnected. The Fibonacci sequence is: 1, 1, 2, 3, 5, 8, 13, 21, 34, 55, 89, 144, 233, 377, 610, 987, ....
This Golden Ratio indicator automatically plots 5 support levels and 5 resistance levels based on the golden ratio for current timeframe. It shows a possible price range for current session, you can easily identify the major and minor support/resistance levels from the chart.
The levels of support and resistance are formed at the beginning of a new session
This indicator works on all default time frames.
It will never repaint.
There is no parameter. All you need to do is to load it to your chart.
Click the image links to view it in original size.
https://3.bp.blogspot.com/-Zw8QTkYwd-g/VvBe0YJCtVI/AAAAAAAADfE/i4A7lrDreV0iKIIL5_ItV6vM7FIzwPC6A/s1600/1.png
https://2.bp.blogspot.com/-qo0RL9Tp9dc/VvBe1GHX1RI/AAAAAAAADfE/ZqSqMXh2zjsWU9wR-W3dek2B8nSLwro2A/s1600/2.png
https://2.bp.blogspot.com/-uKEQO63Ewts/VvBe1cgHj2I/AAAAAAAADfE/K9ewGQhtQkI8vns2ZHP6yM7EoQgpU2t2g/s1600/3.png
https://3.bp.blogspot.com/-GE6uQcaEud0/VvBe1gLQ1mI/AAAAAAAADfE/iW_Bda4uhLAn1Y2oBybuIwtNoEnyvclXw/s1600/4.png
https://2.bp.blogspot.com/-lDjpfnzB_7s/VvBe1xiI7tI/AAAAAAAADfE/v-XbGiN2aYw-MxfmdbuKVp_CRhoEyivxQ/s1600/5.png
https://2.bp.blogspot.com/-aHNBhx0P5Uc/VvBe2z1cMMI/AAAAAAAADfE/3_zxNtctEewoYsSwpOm3YUtp_h2H5LshQ/s1600/8.png
https://1.bp.blogspot.com/-saKT5VRAeOI/VvBe3BXuHFI/AAAAAAAADfE/btBeiwKdi_sVRkwcv-RkEgq4daljIWVpg/s1600/0.png
////////////////////////////////////////////////////////////
// Technical Analysis & Research Patternsmart
//
// Custom indicators, Strategies, SCAN, Screener, Backtesting, Converting service for:
// Tradingview, NinjaTrader, Thinkorswim, MetaTrader, MetaStock, Multicharts, Prorealtime, etc.
////////////////////////////////////////////////////////////
Script protégé
Ce script est publié en source fermée. Cependant, vous pouvez l'utiliser librement et sans aucune restriction – pour en savoir plus, cliquez ici.
Clause de non-responsabilité
Les informations et publications ne sont pas destinées à être, et ne constituent pas, des conseils ou recommandations financiers, d'investissement, de trading ou autres fournis ou approuvés par TradingView. Pour en savoir plus, consultez les Conditions d'utilisation.