PROTECTED SOURCE SCRIPT
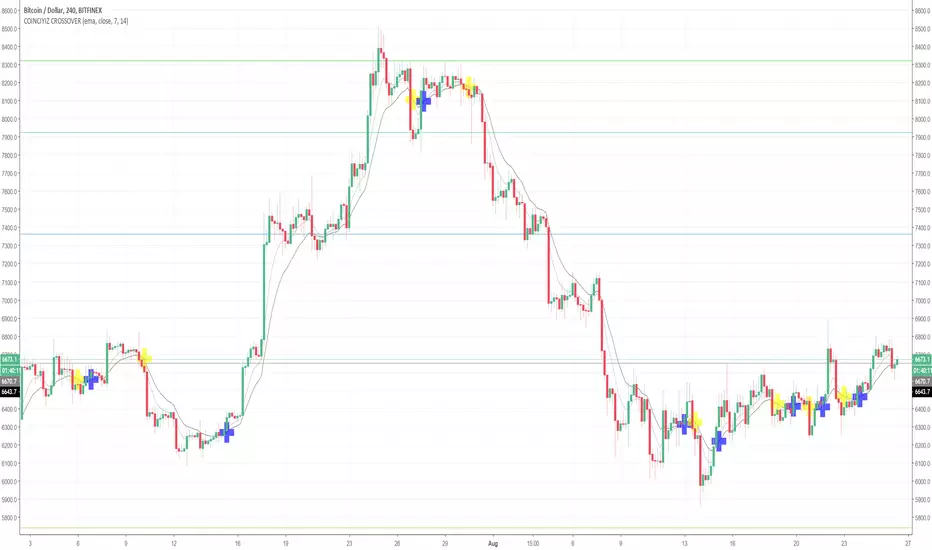
COINCIYIZ CROSSOVER 1.1
A crossover is used by a technical analyst to forecast how a stock will perform in the near future. For most models, the crossover signals that it’s time to either buy or sell the underlying asset. Investors use crossovers along with other indicators to track things like turning points, price trends and money flow.
Crossovers indicating a moving average are generally the cause of breakouts and breakdowns. Moving averages can determine a change in the price trend based on the crossover. For example, a technique for trend reversal is using a five-period simple moving average along with a 9/21-period simple moving average. A crossover between the two will signal a reversal in trend, or a breakout or breakdown.
A breakout would be indicated by the five-period moving average crossing up through the 21-period. This is also indicative of an uptrend, which is made of higher highs and lows. A breakdown would be indicated by the five-period moving average crossing down through the 9/21-period. This is also indicative of a downtrend, composed of lower highs and lows.
Longer time frames result in stronger signals. For example, a daily chart carries more weight than a one-minute chart. Conversely, the shorter time frames give earlier indicators, but they are also susceptible to false signals as well.
(R: investopedia)
Short signal - Yellow
Long signal - Blue
Script protégé
Ce script est publié en source fermée. Cependant, vous pouvez l'utiliser librement et sans aucune restriction – pour en savoir plus, cliquez ici.
Clause de non-responsabilité
Les informations et publications ne sont pas destinées à être, et ne constituent pas, des conseils ou recommandations financiers, d'investissement, de trading ou autres fournis ou approuvés par TradingView. Pour en savoir plus, consultez les Conditions d'utilisation.