OPEN-SOURCE SCRIPT
Mis à jour Trendlines Strategy
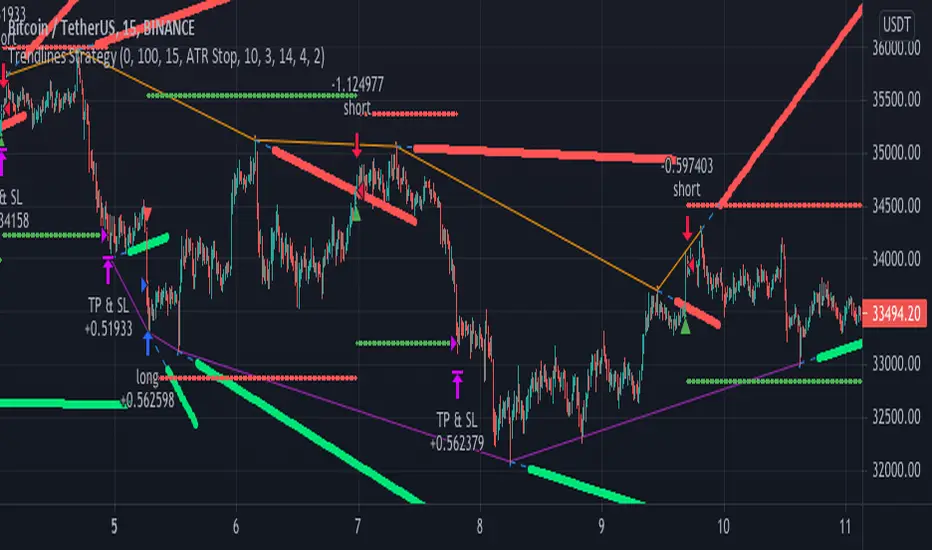
Using the clever calculations and code by BacktestRookies, here is a strategy that buys
when the price breaks above the trend line and sells (or shorts) when it crosses below.
This logic can be reversed, which seems to work better with recent market conditions.
when the price breaks above the trend line and sells (or shorts) when it crosses below.
This logic can be reversed, which seems to work better with recent market conditions.
Notes de version
"A general explanation of the indicator would be a good place to start. In it, we plot two trend lines at any given time. A resistance trend line and a support trend line. The resistance trend is shown with red circles and is created by joining swing highs together. The second is a support trend which is created by joining swing lows.Since we need swings to make the trend, the trend line code contains code for the swing detection. You can play around with the swing detection to alter how frequently new trend lines are detected. Relying on swings also means that there will be some delay in trend detection depending on how you configure the swing detection. The higher you set rightbars, the more lag you will have before a trend is detected. However, at the same time the quality of the pivots found will increase. So it is a trade-off you need to come to terms with and decide what the best settings are for you.
A single trend line is made up of several components.
Pivot Points: Marked as blue or orange circles. There will be two pivots per trend.
Orange/Purple Lines: Connecting all pivot points. You will see these lines change direction slightly each time a new pivot is detected (new circles appear).
Green/Red Circle lines: Showing the trend line from the earliest moment a new trend is detected.
Blue Dashed lines: Joining the purple and green/red circle lines so the full trend line can be seen.
Note: The blue dashed lines use pine-scripts drawing functions. As such, there is a limit to how many of these can be placed on a chart. When the limit is reached, the oldest line will be removed so the newest can be drawn. This means that if you detect enough trends and scroll back in time, the blue dashed lines will disappear at some point!"
Script open-source
Dans l'esprit TradingView, le créateur de ce script l'a rendu open source afin que les traders puissent examiner et vérifier ses fonctionnalités. Bravo à l'auteur! Bien que vous puissiez l'utiliser gratuitement, n'oubliez pas que la republication du code est soumise à nos Règles.
Clause de non-responsabilité
Les informations et publications ne sont pas destinées à être, et ne constituent pas, des conseils ou recommandations financiers, d'investissement, de trading ou autres fournis ou approuvés par TradingView. Pour en savoir plus, consultez les Conditions d'utilisation.