Mawreez' RSI Divergence Detector
Mis à jour
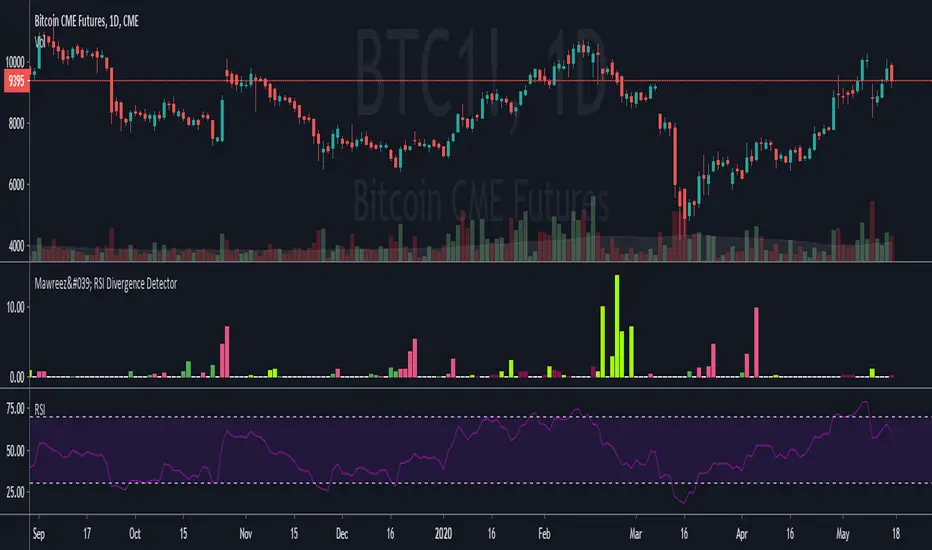
The idea behind this indicator is to have an expression for the amount of divergence on a given chart at every point in time. To achieve this, it adds up the magnitudes any valid divergence of any kind; bullish, bearish or their hidden variants. Where a valid divergence consists of a line on the source series (almost always the closing price), and a line on an oscillator (here: the RSI). The slopes of said lines must have opposite signs, that is to say, one line must be sloping up while the other slopes down. Said lines may not cross their respective series.
The length of the RSI is configurable (default length: 14). The lengths of the divergences are configurable (default: minimum length 3 and maximum length 28 - the latter being twice the default length of the RSI).
This indicator will detect divergences which are still building up. Be duly warned: upcoming divergences may still get invalidated. Another case that one should be very mindful of is that an upcoming divergence may still increase in magnitude before it plays out. Possibly over several more timesteps, there may even be entire additional drives.
The value of this indicator indeed reflects the magnitude of divergence on a chart. However, there is no reason to think the magnitude of a divergence affects the likelihood of said divergence playing out.
The color of the indicator indicates the kind of divergence. The default colors are
Please let me know if you would like to see a version of this indicator that plots both the RSI and this histogram. I will do this for personal use, but I am being a bit of a purist with this publication.
In fact, please don't hesitate to make any comment or to give any kind of suggestion.
The length of the RSI is configurable (default length: 14). The lengths of the divergences are configurable (default: minimum length 3 and maximum length 28 - the latter being twice the default length of the RSI).
This indicator will detect divergences which are still building up. Be duly warned: upcoming divergences may still get invalidated. Another case that one should be very mindful of is that an upcoming divergence may still increase in magnitude before it plays out. Possibly over several more timesteps, there may even be entire additional drives.
The value of this indicator indeed reflects the magnitude of divergence on a chart. However, there is no reason to think the magnitude of a divergence affects the likelihood of said divergence playing out.
The color of the indicator indicates the kind of divergence. The default colors are
- green for bullish divergence,
- maroon (dark red) for bearish divergence,
- lime/light green for hidden bullish divergence,
- dark pink for hidden bearish divergence.
Please let me know if you would like to see a version of this indicator that plots both the RSI and this histogram. I will do this for personal use, but I am being a bit of a purist with this publication.
In fact, please don't hesitate to make any comment or to give any kind of suggestion.
Notes de version
At release I forgot to note that this indicator is particularly good at indicating the complete absence of divergence. I often see the question whether a chart contains divergence. If this indicator has a value of 0 at some point, then at that point there is absolutely no divergence. At least no divergence of a length the indicator is configured to detect.I was originally going to leave it to the user of this indicator
- to verify the validity of a possible divergence and
- to determine the type of a possible divergence.
I was able to satisfyingly automate the identification of divergence types. However, verifying validity is still left to the user. There will be false positives. In an attempt to automate more of the validation process, I wrote code
- to check for tops and bottoms, and
- to check whether all values in a series are above or below a line.
Applying these principles did not actually lead to satisfying results. Many of the good reads were no longer recognized. I provided the aformentioned code in case anyone wants to have a go for themselves. Feel free to drop comments or further suggestions. Otherwise, this is probably as far as I'll go with this indicator.
Script open-source
Dans le plus pur esprit TradingView, l'auteur de ce script l'a publié en open-source, afin que les traders puissent le comprendre et le vérifier. Bravo à l'auteur! Vous pouvez l'utiliser gratuitement, mais la réutilisation de ce code dans une publication est régie par nos Règles. Vous pouvez le mettre en favori pour l'utiliser sur un graphique.
Clause de non-responsabilité
Les informations et les publications ne sont pas destinées à être, et ne constituent pas, des conseils ou des recommandations en matière de finance, d'investissement, de trading ou d'autres types de conseils fournis ou approuvés par TradingView. Pour en savoir plus, consultez les Conditions d'utilisation.