OPEN-SOURCE SCRIPT
RSI Screener Multi Timeframe [5ema]
Mis à jour
This indicator is the simple version of my indicator: RSI Screener and Divergence .
Only show table with values, signals at 5 custom timeframes.
-----
I reused some functions, made by (i believe that):
©paaax: The table position function.
kingthies: The RSI divergence function.
QuantNomad: The function calculated value and array screener for 40+ instruments.
I have commented in my code. Thanks so much!
-----
How it works:
1. Input :
2. Input bool:
3. Basic calculated:
4. Condition of signal:
Buy condition:
=> Buy if (1) and (2), review buy (1) or (2).
Sell condition:
=> Sell if (3) and (4), review sell (3) or (4).
-----
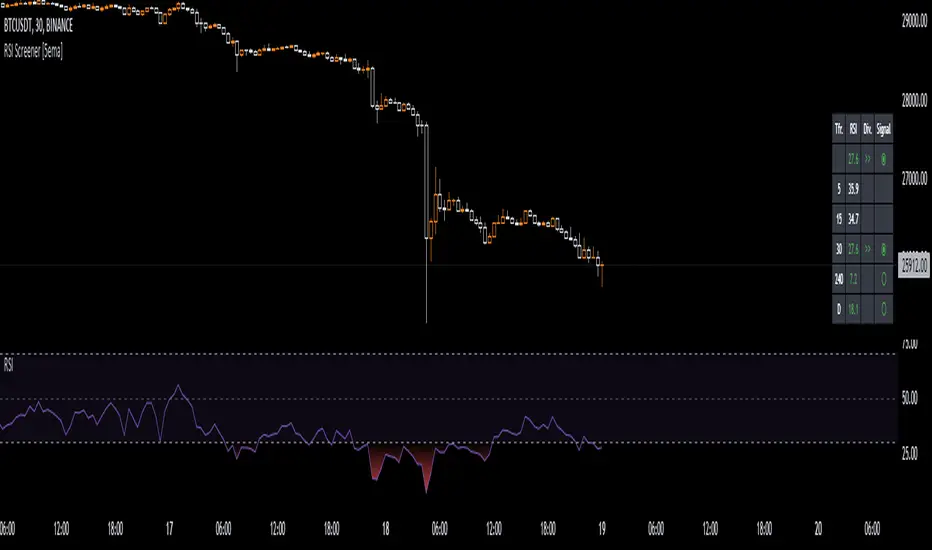
Table screener:
- Regular Bearish divergence:

- Regular Bullish divergence:

- Regular Bullish divergence + RSI overSold

- Regular Bearish divergence + RSI overBought

-----
This indicator is for reference only, you need your own method and strategy.
If you have any questions, please let me know in the comments.
Only show table with values, signals at 5 custom timeframes.
-----
I reused some functions, made by (i believe that):
©paaax: The table position function.
kingthies: The RSI divergence function.
QuantNomad: The function calculated value and array screener for 40+ instruments.
I have commented in my code. Thanks so much!
-----
How it works:
1. Input :
- Length of RSI => calculate RSI.
- Upper/lower => checking RSI overbought/oversold.
- Right bars / left bars => returns price of the pivot low & high point => checking divergence.
- Range upper / lower bars => compare the low & high point => checking divergence.
- Timeframe => request.security another time frame.
- Table position => display screener table.
2. Input bool:
- Regular Bearish divergence.
- Hidden Bullish divergence .
- Hidden Bearish divergence.
3. Basic calculated:
- Make function for RSI , pivot low & high point of RSI and price.
- Request.security that function for earch time frame.
- Result RSI, Divergence.
4. Condition of signal:
Buy condition:
- RSI oversold (1)
- Bullish divergence (2).
=> Buy if (1) and (2), review buy (1) or (2).
Sell condition:
- RSI overbought (3).
- Bearish divergence (4).
=> Sell if (3) and (4), review sell (3) or (4).
-----
Table screener:
- Time frame.
- RSI (green - oversold, red - overbought)
- Divergence (>> - regular bullish , << regular bearish , > - hidden bullish , < - hidden bearish ).
- Signal (green ⦿ - Buy, red ⦿ - Sell, green 〇 - review buy, red 〇 - review sell).
- Regular Bearish divergence:
- Regular Bullish divergence:
- Regular Bullish divergence + RSI overSold
- Regular Bearish divergence + RSI overBought
-----
This indicator is for reference only, you need your own method and strategy.
If you have any questions, please let me know in the comments.
Notes de version
Add up RSI MA.Notes de version
sorry!i update its code again
Notes de version
- Optimizing the code
- Add theme color
Notes de version
wrong contentScript open-source
Dans le plus pur esprit TradingView, l'auteur de ce script l'a publié en open-source, afin que les traders puissent le comprendre et le vérifier. Bravo à l'auteur! Vous pouvez l'utiliser gratuitement, mais la réutilisation de ce code dans une publication est régie par nos Règles. Vous pouvez le mettre en favori pour l'utiliser sur un graphique.
Clause de non-responsabilité
Les informations et les publications ne sont pas destinées à être, et ne constituent pas, des conseils ou des recommandations en matière de finance, d'investissement, de trading ou d'autres types de conseils fournis ou approuvés par TradingView. Pour en savoir plus, consultez les Conditions d'utilisation.