OPEN-SOURCE SCRIPT
Volume-Weighted RSI [wbburgin]
Mis à jour
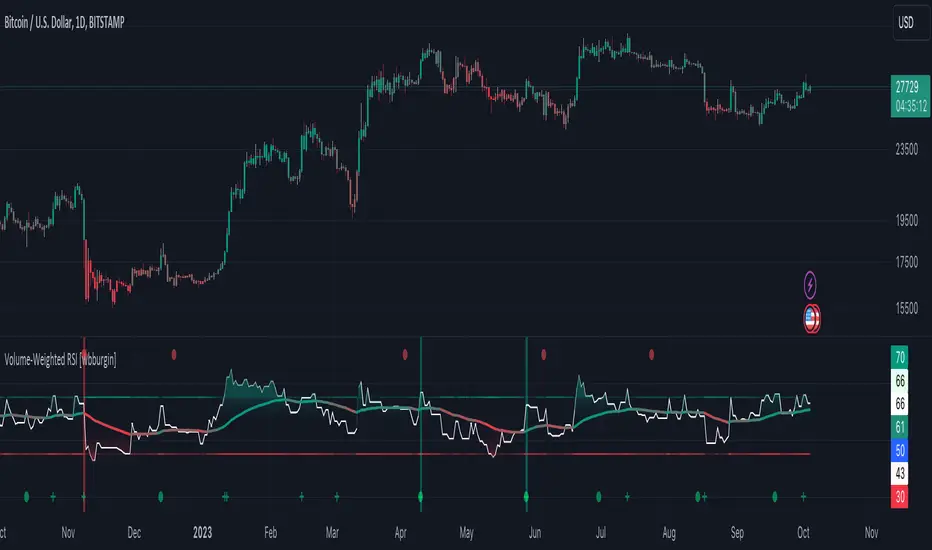
The Volume-Weighted RSI takes a new approach to the traditional calculation of the RSI in using a price::volume calculation. As some traders consider volume to be a leading indicator for price, the volume-weighted RSI can come in handy if you want to visualize volume easier.
Usage
This indicator builds the RSI from the square of the volume change and the price. If the volume decreases rapidly with the price, the volume-weighted RSI will fall; if the volume increases rapidly with the price, the volume-weighted RSI will rise.
You may notice crosses and circles appearing above and below the indicator. These indicate abnormal volume or price:
A green bar indicates both abnormal price and volume (positive), while a red bar indicates both abnormal price and volume (negative).
The thresholds of what are considered "normal" and "abnormal" are controlled by the "SD Multiple" in your settings (standard deviation). A higher multiple will make less of these signals occur, and you can turn them and the bars off at any time.
I have a built-in Light Style and Dark Style so that your preference of background won't affect seeing the indicator. You can also change the colors and the overbought/oversold lines in your settings.
Usage
This indicator builds the RSI from the square of the volume change and the price. If the volume decreases rapidly with the price, the volume-weighted RSI will fall; if the volume increases rapidly with the price, the volume-weighted RSI will rise.
You may notice crosses and circles appearing above and below the indicator. These indicate abnormal volume or price:
- A green cross indicates abnormal upward price
- A red cross indicates abnormal downward price
- A green circle indicates abnormal positive volume
- A red circle indicates abnormal negative volume
A green bar indicates both abnormal price and volume (positive), while a red bar indicates both abnormal price and volume (negative).
The thresholds of what are considered "normal" and "abnormal" are controlled by the "SD Multiple" in your settings (standard deviation). A higher multiple will make less of these signals occur, and you can turn them and the bars off at any time.
I have a built-in Light Style and Dark Style so that your preference of background won't affect seeing the indicator. You can also change the colors and the overbought/oversold lines in your settings.
Notes de version
Added 'plot volume-weighted RSI' option to the settings to turn the RSI on/off (use this instead of going into 'style').Notes de version
Previous code included an unnecessary argument which would cause a bug under specific circumstances.Notes de version
Added alerts for abnormal volume, abnormal price, and RSI crossoversScript open-source
Dans le plus pur esprit TradingView, l'auteur de ce script l'a publié en open-source, afin que les traders puissent le comprendre et le vérifier. Bravo à l'auteur! Vous pouvez l'utiliser gratuitement, mais la réutilisation de ce code dans une publication est régie par nos Règles. Vous pouvez le mettre en favori pour l'utiliser sur un graphique.
FAQ: I am gradually phasing out my Patreon because of the time it takes to maintain.
BTC: 35PdMMMXFCvPjXKwn8wsRFNwMEPgStaKUJ
Test my strategies on CryptoRobotics: cryptorobotics.co/?trade=f23b09
BTC: 35PdMMMXFCvPjXKwn8wsRFNwMEPgStaKUJ
Test my strategies on CryptoRobotics: cryptorobotics.co/?trade=f23b09
Clause de non-responsabilité
Les informations et les publications ne sont pas destinées à être, et ne constituent pas, des conseils ou des recommandations en matière de finance, d'investissement, de trading ou d'autres types de conseils fournis ou approuvés par TradingView. Pour en savoir plus, consultez les Conditions d'utilisation.