OPEN-SOURCE SCRIPT
NCI Trading Plan (Individual Asset)

NCI Trading Plan (Individual Asset)- By LightNCI
NCI, which stands for New Concept Integration by Jayce PHAM, is a comprehensive approach that incorporates various critical aspects of trading to provide a logical, structured, and integrated approach to the financial markets. NCI covers market structure, key levels, smart money concepts, multiple timeframes and market cycles
About the NCI Trading Plan (Individual Asset) Indicator
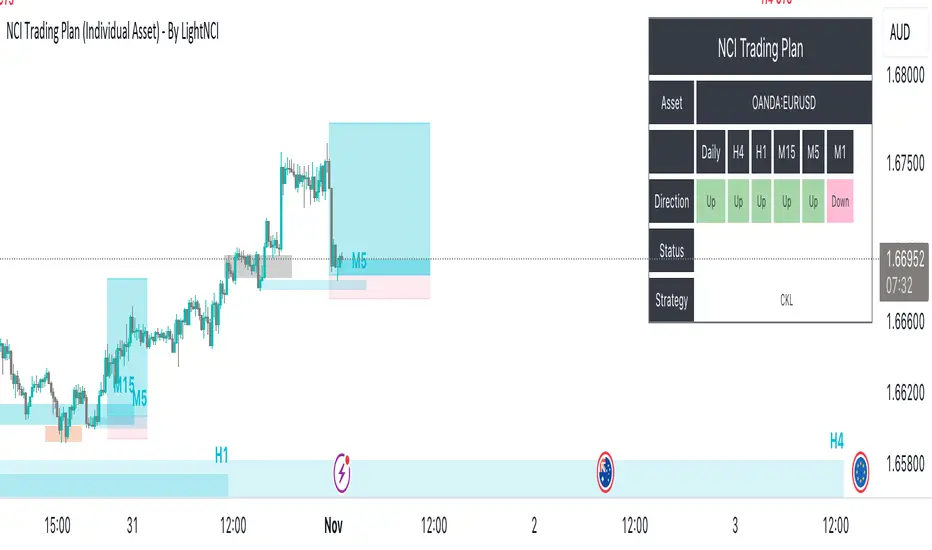
The NCI Trading Plan is just a table allowing traders to keep track of a single asset, but multiple timeframe status on a single table, ensuring a comprehensive overview of trading statuses and strategies for each timeframe. The status is not automatically update. Using the NCI strategy, you may update it yourself the status of each timeframe.
Features
1. Display column for Daily, H4, H1, M15, M5, M1: Designed to support multi-timeframe analysis.
2. Direction Status Indication: Visualise the direction of each timeframe.
3. Dynamic Status Indication: Visualize the trading status for each asset:
i. Monitor: Asset is under review or surveillance.
ii. Confirmation: A potential trading signal or setup is being confirmed.
iii. Entry Set: An order for the asset has been placed.
iv. Forward-Test: An asset under monitored for it to being forward test.
4. Strategy Indication: Each asset can be tagged with a specific strategy identifier:
i. CKL: Confluence Key Level
ii. UKL: Un-Confluence Key Level
iii. SMC: Smart Money Concept
iv. BRT: Break & Re-Test
v. RTNKL: Re-Test of New Key Level
5. Stylisation: Color-code the statuses, table and fonts to suit your visual preference.
How to use
1. Asset Name: Select asset from the list
2. Timeframe Direction: Choose direction for each timeframe.
3. Status Selection: Choose the current trading status for each asset.
4. Strategy Selection: Assign a trading strategy to each asset.
5. Style: Customise the appearance of your trading plan by selecting preferred colours for different statuses and headers.
Conclusion
The NCI Trading Plan ensures a systematic and organised approach to multi-time frame trading. By maintaining a visual overview of multi-time frame analysis and their corresponding trading statuses and strategies, traders can efficiently manage their portfolio and ensure timely decision-making.
Tip: To reset or modify an asset's status or strategy, simply adjust the settings in the panel on the left. The table will update in real-time.
Script open-source
Dans l'esprit TradingView, le créateur de ce script l'a rendu open source afin que les traders puissent examiner et vérifier ses fonctionnalités. Bravo à l'auteur! Bien que vous puissiez l'utiliser gratuitement, n'oubliez pas que la republication du code est soumise à nos Règles.
Clause de non-responsabilité
Les informations et publications ne sont pas destinées à être, et ne constituent pas, des conseils ou recommandations financiers, d'investissement, de trading ou autres fournis ou approuvés par TradingView. Pour en savoir plus, consultez les Conditions d'utilisation.