PROTECTED SOURCE SCRIPT
Mis à jour Correlation of Price Spread and Volume
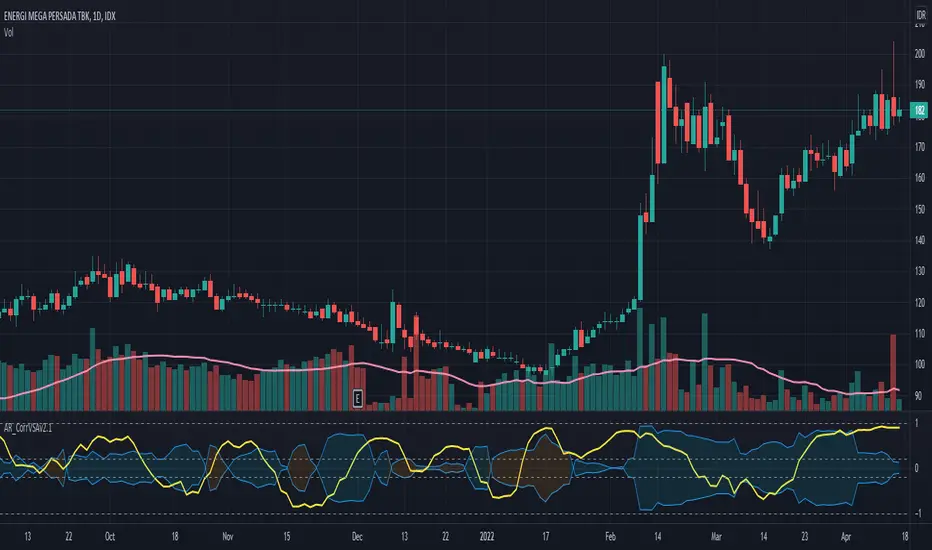
Correlation between candle's price spread (length of candle of each bar) and volume.
Generally, increases in volume precede significant price movements. However, If the price is rising in an uptrend but the volume is reducing, it may show that there’s little interest in the instrument, and the price may reverse.
The closer the correlation is to 1.0, indicates the instruments will move up and down together as it is expected with volume and price spread. So the correlation Indicator aims to display when the price spread and volume is in correlation and not. Blue color represent positive correlation while orange negative correlation. The strength of the correlation is determined by the width of the bands.
Notes de version
Added horizontal lines to indicate the strength of the correlation (default 0.2).Notes de version
Updated the titleNotes de version
Fix the algorithmNotes de version
Added yellow line for the correlation with the user-selected instrument.Notes de version
Changed the default length parameterScript protégé
Ce script est publié en source fermée. Cependant, vous pouvez l'utiliser librement et sans aucune restriction – pour en savoir plus, cliquez ici.
Clause de non-responsabilité
Les informations et publications ne sont pas destinées à être, et ne constituent pas, des conseils ou recommandations financiers, d'investissement, de trading ou autres fournis ou approuvés par TradingView. Pour en savoir plus, consultez les Conditions d'utilisation.
Script protégé
Ce script est publié en source fermée. Cependant, vous pouvez l'utiliser librement et sans aucune restriction – pour en savoir plus, cliquez ici.
Clause de non-responsabilité
Les informations et publications ne sont pas destinées à être, et ne constituent pas, des conseils ou recommandations financiers, d'investissement, de trading ou autres fournis ou approuvés par TradingView. Pour en savoir plus, consultez les Conditions d'utilisation.