Overbalance
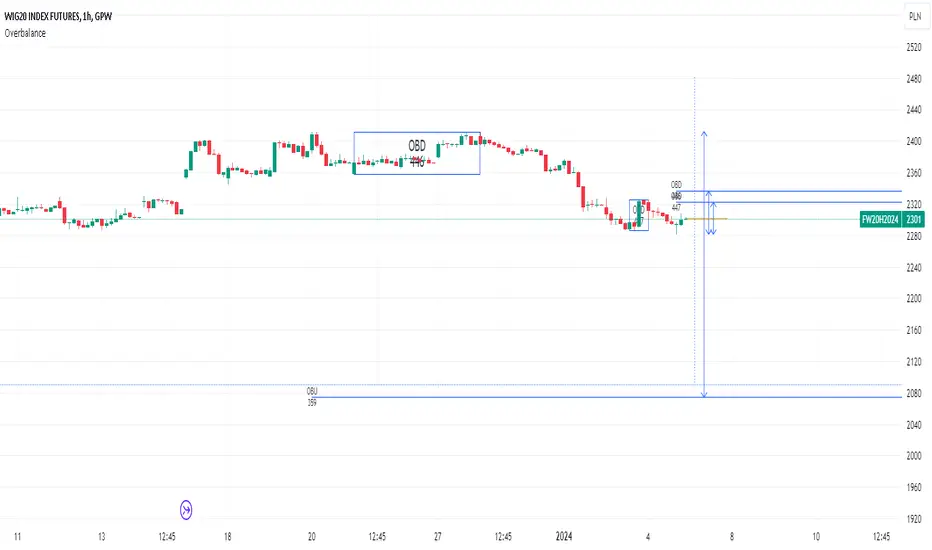
Based on last trend extreme value (low or high) it can draw line symbolizing correction equal to
the biggest correction in that trend. It can track up to 20 independent (both up and down) trends on one chart.
Overbalance method works on an assumption that trend continues until we have correction bigger than the biggest existing correction in that trend. Comparing the historically biggest correction with the current one can give a warning signal.
There are markets and instruments for which the size of corrections is repeated, and tracking corrections in the trend can be used to predict the trend change moment. - Just remember that if something happened in the past it is not guaranteed that it will happen again.
This script can be used by ANY user. You DO NOT NEED to have PRO or PREMIUM account to use it.
Script settings:
Trend min change [%] - Filter out price moves smaller than % of current price.
OB up - Showing overbalance in up trends
OB down - Showing overbalance in down trends
Historical with precision [%] - Showing corrections moves that were equal to biggest previous correction in that trend with a given (%) precision.
OB prediction up - Showing overbalance threshold in current up trends
OB prediction down - Showing overbalance threshold in current down trends
OB Exceeded - Showing broken overbalance thresholds
Arrows - Showing overbalance thresholds with an arrows
(with labels) - Showing labels over overbalance threshold arrows
Price line - It draws a line at the price level, under the arrows.
Troubleshooting:
In case of any problems, send error details to the author of the script.
- Table with all trends, overbalance values and fib retracements factors.
- Broken trends are marked in the table with the red background
- New settings section:
Table: Position - Defining place where table will be drawn
Text - Defining table text size
List of fields visible in the table:
From value - Showing price value at the start point of a trend.
From time - Showing for how many days this trend exist.
Fib. retr. max - Showing what was the maximal fibonacci retracement for this trend.
Fib. retr. cur - Showing fibonacci retracement value for the current price.
Fib retr. OB - Showing fibonacci retracement value for overbalance threshold.
Ob. distance - Showing price distance from the overbalance threshold.
Verify Fib retr with inaccuracy ‰ - Feature that is highlighting fibonacci retracement values having value around typical fibonacii value with the provided precision ( in ‰)
Script sur invitation seulement
Seuls les utilisateurs autorisés par l'auteur ont accès à ce script, et cela nécessite généralement un paiement. Vous pouvez ajouter le script à vos favoris, mais vous ne pourrez l'utiliser qu'après avoir demandé et obtenu l'autorisation de son auteur - en savoir plus ici. Pour plus de détails, suivez les instructions de l'auteur ci-dessous ou contactez directement Investor_R.
TradingView ne recommande PAS de payer ou d'utiliser un script à moins que vous ne fassiez entièrement confiance à son auteur et que vous compreniez comment il fonctionne. Vous pouvez également trouver des alternatives gratuites et open-source dans nos scripts communautaires.
Instructions de l'auteur
Attention: veuillez lire notre guide pour les scripts sur invitation uniquement avant de demander l'accès.
More details on Website and Youtube.
Clause de non-responsabilité
Script sur invitation seulement
Seuls les utilisateurs autorisés par l'auteur ont accès à ce script, et cela nécessite généralement un paiement. Vous pouvez ajouter le script à vos favoris, mais vous ne pourrez l'utiliser qu'après avoir demandé et obtenu l'autorisation de son auteur - en savoir plus ici. Pour plus de détails, suivez les instructions de l'auteur ci-dessous ou contactez directement Investor_R.
TradingView ne recommande PAS de payer ou d'utiliser un script à moins que vous ne fassiez entièrement confiance à son auteur et que vous compreniez comment il fonctionne. Vous pouvez également trouver des alternatives gratuites et open-source dans nos scripts communautaires.
Instructions de l'auteur
Attention: veuillez lire notre guide pour les scripts sur invitation uniquement avant de demander l'accès.
More details on Website and Youtube.