OPEN-SOURCE SCRIPT
RSI Go long

Giving all credit to celena at WarriorTrading for the idea behind this script.
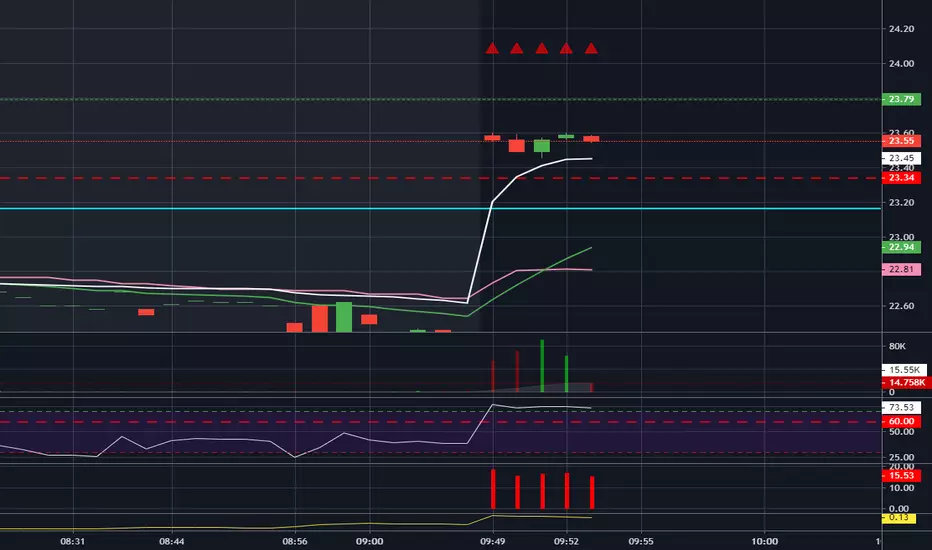
The script is pretty basic and self-explanatory. We will use certain RSI levels both on 5min and 1min to determine the strength/momentum of a stock.
The idea is to monitor 5m and 1m timeframes at once. if the RSI starts to test the initial level, we will see a plot on the graph ( default color is orange ). If we reach our target level and above, bar colors will change to default color green. If this happens in both 1min and 5 min timeframe it is an indicator of the strength of the stock. This indicator coupled with our own strategy helps us reinforce the idea for long entries.
Script open-source
Dans l'esprit TradingView, le créateur de ce script l'a rendu open source afin que les traders puissent examiner et vérifier ses fonctionnalités. Bravo à l'auteur! Bien que vous puissiez l'utiliser gratuitement, n'oubliez pas que la republication du code est soumise à nos Règles.
Trying to figure out trading, one chart at a time.
Just throwing away stupid trading ideas, these are not buy/sell alerts so please do your own due diligence.
Just throwing away stupid trading ideas, these are not buy/sell alerts so please do your own due diligence.
Clause de non-responsabilité
Les informations et publications ne sont pas destinées à être, et ne constituent pas, des conseils ou recommandations financiers, d'investissement, de trading ou autres fournis ou approuvés par TradingView. Pour en savoir plus, consultez les Conditions d'utilisation.