OPEN-SOURCE SCRIPT
MACD Crossover with +/- Filter
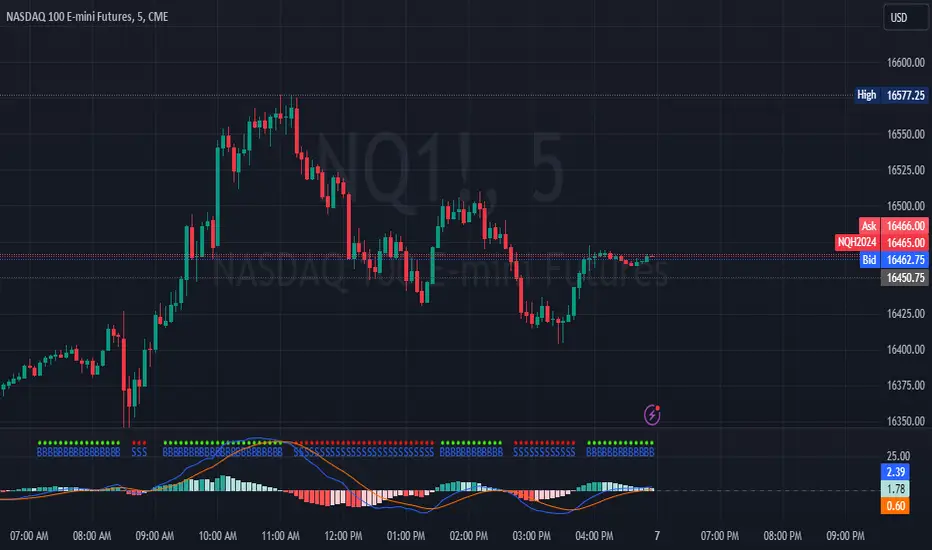
This is to directly target when MACD crosses the Signal line. The purpose of this script is to target a +/- change of 3 in the MACD value after the most recent cross. It uses the value of the MACD line and holds it until a value of 3.00 + or - a crossover or crossunder happens. That's the significance of the red and green circles that appear on the chart. This is not financial advice, but I wanted to recreate what a friend of mine was doing manually and automate it for him.
The first circle that appears after MACD/SIGNAL lines cross would represent a potential trade idea. The circles after the first one match the intention of the first dot as they meet the condition of more than a value of -3 or +3 as the previous dot.
Inputs:
Standard Inputs as normal MACD (Moving Average Converging Divergence) within TradingView
Fast Length: User can change it to any value they want
Slow Length: User can change it to any value they want
Standard 12, 26, 9 as normal MACD // 9 being signal smoothing
Oscillator and Signal Line moving average type is using EMA's
Timeframe is dependent on user chart.
Circles are used for signaling the change in values. Red indicates a short-term bearish trend. Green indicates a short-term bullish trend.
Tested on lower timeframes:
1m, 3m, 5m, 15m, 60m
Not used as much on higher timeframes. Used for trading futures. This is what I use it for. It can be used for other futures than just NQ or ES, but those 2 are the ones that I've tested. Code it shown below for users to tinker with.
Style of indication symbol can be changed via settings within the indicator in the "Style" tab, as well as location of the symbol(s). Additionally, color can be changed as well, if you prefer different colors.
Not financial advice. Just trade ideas.
Script open-source
Dans l'esprit de TradingView, le créateur de ce script l'a rendu open-source, afin que les traders puissent examiner et vérifier sa fonctionnalité. Bravo à l'auteur! Vous pouvez l'utiliser gratuitement, mais n'oubliez pas que la republication du code est soumise à nos Règles.
Clause de non-responsabilité
Les informations et les publications ne sont pas destinées à être, et ne constituent pas, des conseils ou des recommandations en matière de finance, d'investissement, de trading ou d'autres types de conseils fournis ou approuvés par TradingView. Pour en savoir plus, consultez les Conditions d'utilisation.