OPEN-SOURCE SCRIPT
Mis à jour Oscillator Spectrogram
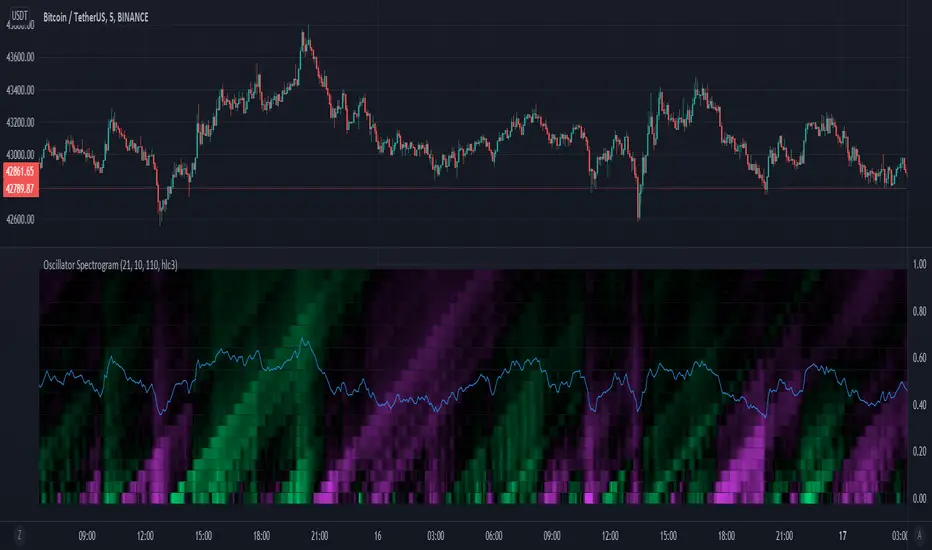
A spectrogram of simple oscillators over varying periods.
Oscillator periods increase from bottom to top.
Color indicates the value of the oscillator, with fuchsia indicating a negative value, black indicating a value around 0, and lime green indicating a value greater than 0.
The oscillators are simply the percentage of positive movement within a lookback period, with 50 percent centered at 0.
Vertical lines along the spectrogram indicate that multiple oscillators of different periods are changing values, indicating a shift in market character.
Notes de version
Added a line representing the average of all the oscillators.Notes de version
Removed accidental chart addition.Script open-source
Dans l'esprit TradingView, le créateur de ce script l'a rendu open source afin que les traders puissent examiner et vérifier ses fonctionnalités. Bravo à l'auteur! Bien que vous puissiez l'utiliser gratuitement, n'oubliez pas que la republication du code est soumise à nos Règles.
Clause de non-responsabilité
Les informations et publications ne sont pas destinées à être, et ne constituent pas, des conseils ou recommandations financiers, d'investissement, de trading ou autres fournis ou approuvés par TradingView. Pour en savoir plus, consultez les Conditions d'utilisation.
Script open-source
Dans l'esprit TradingView, le créateur de ce script l'a rendu open source afin que les traders puissent examiner et vérifier ses fonctionnalités. Bravo à l'auteur! Bien que vous puissiez l'utiliser gratuitement, n'oubliez pas que la republication du code est soumise à nos Règles.
Clause de non-responsabilité
Les informations et publications ne sont pas destinées à être, et ne constituent pas, des conseils ou recommandations financiers, d'investissement, de trading ou autres fournis ou approuvés par TradingView. Pour en savoir plus, consultez les Conditions d'utilisation.