OPEN-SOURCE SCRIPT
Mis à jour wick CE; plot candle wick and tail midpoint lines
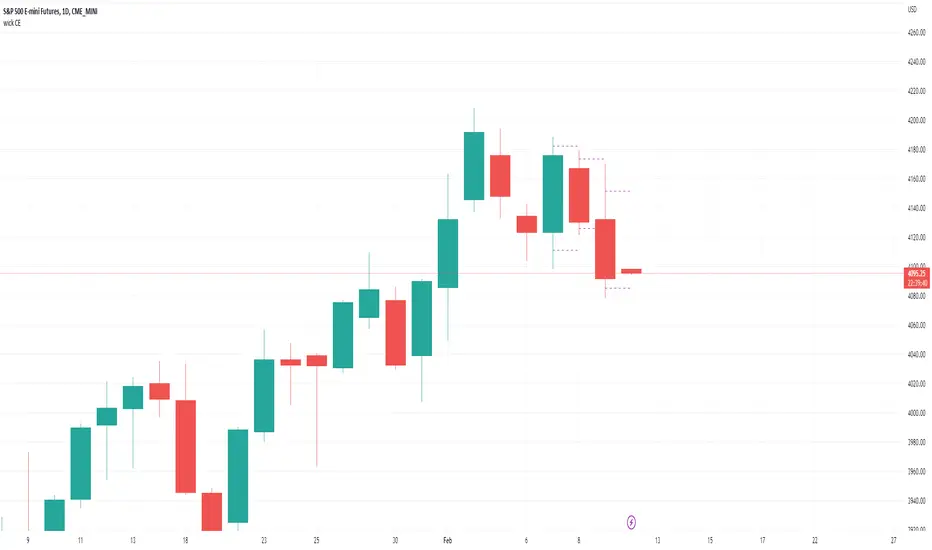
-Simple little tool to plot the wick CE: an ICT concept, consequent encroachment i.e. the midpoint line of a wick or tail; it being a potentially sensitive level (depending on context).
-Wrote this to save me time drawing out fib retracement to locate the precise level of the wick CE. Example usage: show indicator, add horizontal ray over favored wick CE level, hide indicator.
~choose how many consecutive bars back to plot wick CE lines.
~choose how many bars forward to extend the wick CE lines.
Notes de version
-increased max_bars_back and max_lines_count to allow for much larger lookbackNotes de version
-added option to show candle body midlines too ('MT' = mean threshold)Notes de version
-added optional retracement levels (75% and 25% of high-low range); default is off.-added minimum wick size input (based on multiples of chart symbols mintick value) to filter out small wicks; (default = 1; i.e. will only filter out wick CEs where the wick is tiny or non-existent).
-added option to show chart symbol's mintick value in top right corner of chart (default off).
Notes de version
-change show current bar to default trueNotes de version
Updated to include higher timeframe wick CE & tail CE overlayed on lower timeframe chart.Choose between realtime display and previous completed HTF display (default).
Image shows 15min chart with Daily wick CE and tail CE levels displayed.
Notes de version
corrections on screenshot above:*previous trading day
*wick/tail CE levels of previous trading day
Choose from a range of higher timeframe inputs
Script open-source
Dans l'esprit TradingView, le créateur de ce script l'a rendu open source afin que les traders puissent examiner et vérifier ses fonctionnalités. Bravo à l'auteur! Bien que vous puissiez l'utiliser gratuitement, n'oubliez pas que la republication du code est soumise à nos Règles.
You can buy me a coffee here...
PayPal.Me/twingall
BTC: 3JrhUwNRnKyqhaa1n1AXKeAubNeEFoch6S
ETH erc20: 0x4b0400B1c18503529ab69611e82a934DDe4Ab038
ETH bep20: 0x1F0f03F184079bb1085F8C9dF3a8191C9f5869B3
PayPal.Me/twingall
BTC: 3JrhUwNRnKyqhaa1n1AXKeAubNeEFoch6S
ETH erc20: 0x4b0400B1c18503529ab69611e82a934DDe4Ab038
ETH bep20: 0x1F0f03F184079bb1085F8C9dF3a8191C9f5869B3
Clause de non-responsabilité
Les informations et publications ne sont pas destinées à être, et ne constituent pas, des conseils ou recommandations financiers, d'investissement, de trading ou autres fournis ou approuvés par TradingView. Pour en savoir plus, consultez les Conditions d'utilisation.