OPEN-SOURCE SCRIPT
Kernel Regression Ribbon
Mis à jour
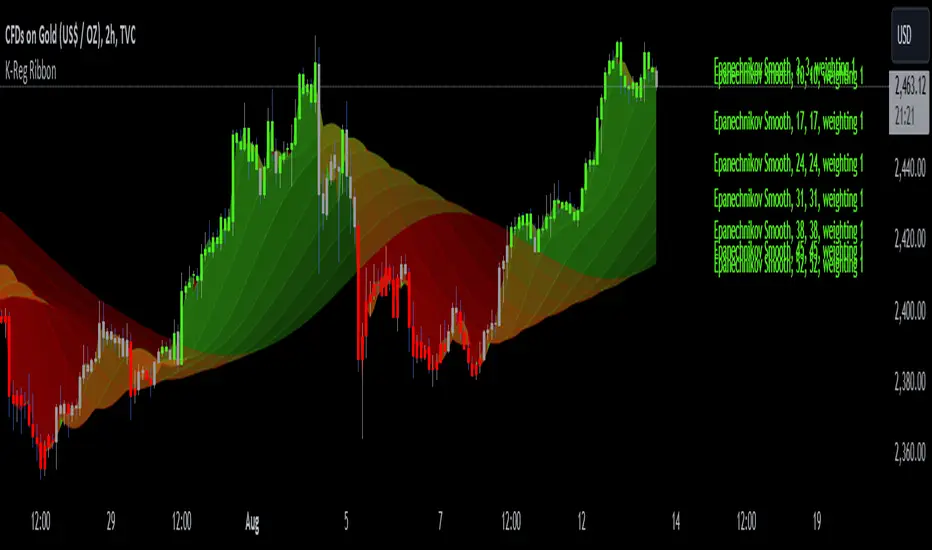
Kernel Regression Ribbon is a flexible, visually pleasing trend identification tool. Plotting 8 different kernel regressions of different types and parameters allows the user to see where levels of support and resistance are being tested, retested and broken.
What’s Kernel Regression?
A statistical method for estimating the best fitting curve for a dataset, in this case, a time/price chart.
How’s Kernel Regression different from a Moving Average?
A Moving Average is basically a simple form of Kernel Regression, in that it uses a fixed (Retangular) Kernel function. In an MA, all data points are weighted equally over its length. However, a Kernel function reacts more to data points that are closer to the current point. This means it will adapt more quickly to changes in data than an MA. Due to this adaptability, Kernel functions often form part of Machine Learning.
Using this indicator:
Explore the default Regular mode first to get a feel for the inputs, which are more numerous than for MAs. Try out different settings, filters and intervals to get the best out of each kernel. Not all parameters are available for each KR. There are info tips to explain this in the menu, but I’ve also included handy, optional labels on the chart for each KR as a more accessible guide.
Once you know your way round the Regular mode, check out the Presets and start changing the parameters of each kernel to your liking in the “User KR1, KR2, … “ mode. Each kernel type has its strong and weak points. Blending different kernels is where this indicator comes into its own. Give your charts a funky shine!
This indicator does NOT repaint.
This script acknowledges, and hopefully showcases, the great work of veryfid Kernel Regression Toolkit.
Notes de version
Bug fixNotes de version
Minor update:Alerts added. Regular, default preset modified.
No change to calculation method.
Notes de version
Added the Epanechnikov kernel, a continuous probability distribution that is defined on a finite interval. Similar to the Rational Quadratic, x-axis weighting can be adjusted.This kernel is less well-known in statistics, as the Gaussian kernel is pretty much the go-to. Epanechnikov, parabolic in nature, may be more efficient.
This addition is displayed in the default setting when you launch the updated version.
Enjoy!
Script open-source
Dans le plus pur esprit TradingView, l'auteur de ce script l'a publié en open-source, afin que les traders puissent le comprendre et le vérifier. Bravo à l'auteur! Vous pouvez l'utiliser gratuitement, mais la réutilisation de ce code dans une publication est régie par nos Règles. Vous pouvez le mettre en favori pour l'utiliser sur un graphique.
Clause de non-responsabilité
Les informations et les publications ne sont pas destinées à être, et ne constituent pas, des conseils ou des recommandations en matière de finance, d'investissement, de trading ou d'autres types de conseils fournis ou approuvés par TradingView. Pour en savoir plus, consultez les Conditions d'utilisation.