PROTECTED SOURCE SCRIPT
Quartile Dots — SharkCIA

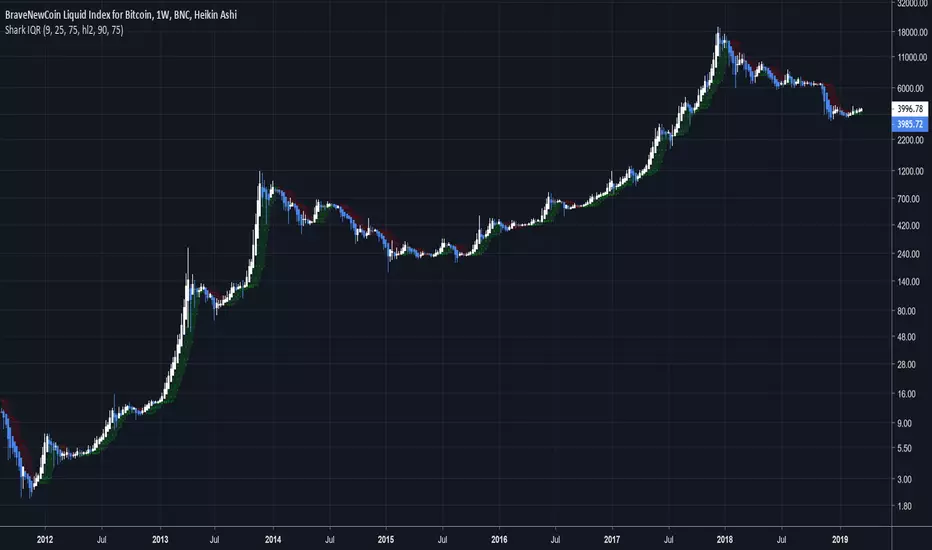
Trend detection for any timeframe.
In statistics, the interquartile range, also called the midspread or middle 50%, is a measure of statistical dispersion, being equal to the difference between 75th and 25th percentiles, or between upper and lower quartiles.
This script works identical to Interquartile Range, but instead of lines on the median and upper/lower quartiles, we're drawing circles instead.

Script protégé
Ce script est publié en code source fermé et vous pouvez l'utiliser librement. Vous pouvez le préférer pour l'utiliser sur un graphique. Vous ne pouvez pas visualiser ou modifier son code source.
Vous voulez utiliser ce script sur un graphique ?
Clause de non-responsabilité
Les informations et les publications ne sont pas destinées à être, et ne constituent pas, des conseils ou des recommandations en matière de finance, d'investissement, de trading ou d'autres types de conseils fournis ou approuvés par TradingView. Pour en savoir plus, consultez les Conditions d'utilisation.