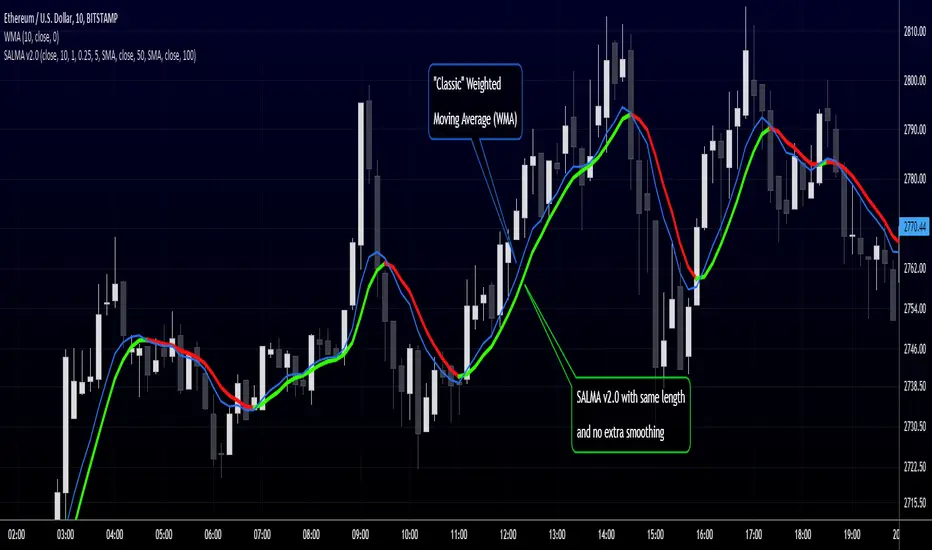
RedK Smooth And Lazy Moving Average (SALMA)Here's a quick and simple script that produces yet another Smooth and Lazy Moving Average - SALMA - that helps hide noise caused by extreme price fluctuations to enable better trend visualization and tracking
Concept:
===========
SALMA is based on a simple concept - we calculate a standard deviation channel of a user-selected width - then correct the price value so that it is restricted within the boundaries of the SD channel - effectively adjusting against high-volatility, sudden price moves - which acts as a pre-smoothing of the price values - then we calculate our moving average and apply extra smoothing as needed.
Since only "persistent" price moves will have an effect on the direction of this MA, it will be suitable to use as an additional trend guide with other indicators, and to consider only long positions when the price is above the SALMA, and short positions only when the price is below
Notes:
========
- for the time being, i'm using Weighted Moving Average (WMA) for the calculation of the base price MA and the SD channel - we can add other MA types as options in a future versions based on feedback
- will add alerts in a future update
- SALMA can be used with any timeframe. can also be set to a higher timeframe against a lower timeframe chart
i have also added couple of standard moving average lines (choose between SMA, EMA and WMA) of selectable lengths - to enable utilizing this in a Moving Average cross-over setup - or to simply monitor other common MA's that other traders are using.
here's how the settings look like when you add SALMA to your chart
Please feel free to play around with SALMA and share feedback :)
Bandes de Bollinger (BB)
Volatility Funnel v2Using the contracting phase of what are basically bollinger bands and some fancy coloring, this indicator draws funnels to which show tightening ranges and doesn't take up too much screen space unless you want it to.
There is a smoothing option if you're into that.
Enjoy!!!

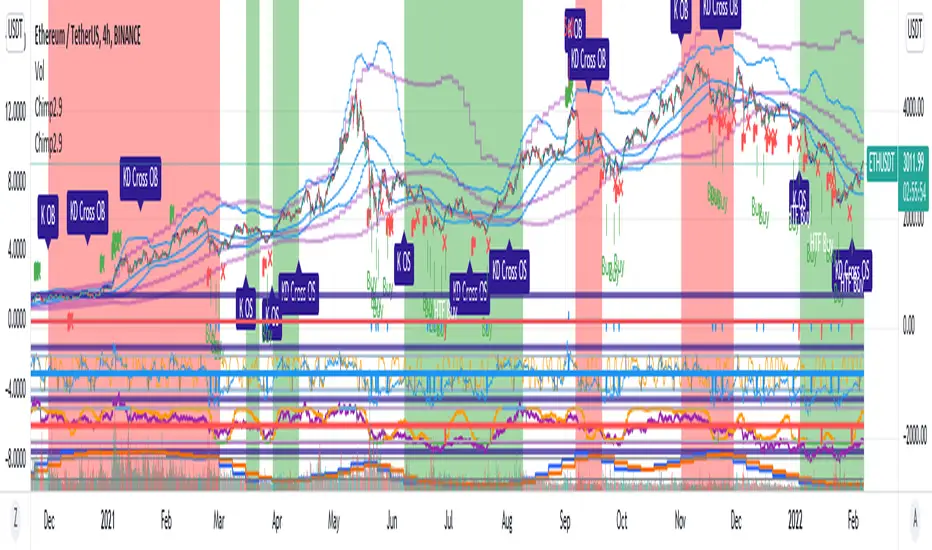
Chimpanzee V2.5 part A by joylay83Hi everyone, I am an amateur pinecoder. I would like to share my script which is coded with the intention of generating signals to send to 3commas webhook. It is still in development and revision.
This collection of indicators use:
Chart: 15m.
Inverse Fisher Transformation of the RSI to detect dips in the 15m timeframe.
Bollinger band (4H) to filter out false signals.
Triple EMA 21: to mimic price action for easier coding alerts. Currently not involved in generating signals. will be incorporated in the future.
StochRSI: As a visual filter. Currently not involved in generating signals. will be incorporated in the future.
Background will be green if stochRSI is low and red if stockRSI is high.
Candlesticks will be marked with a flag is TEMA breached BB.
One would need to play around with timeframes, BB settings and IFTRSI threshold for different signals.
There are 2 Signal Modes (with regards to IFTRSI):
Threshold: When price action falls below BB and IFTRSI hits buy threshold, a buy/sell signal is generated. Eg if IFTRSI buy threshold is set to -0.9, the buy signal will remain continuously positive as long as IFTRSI is < 0.9.
Cross: When price action falls below BB and IFTRSI hits threshold, nothing happens. It will wait until the IFTRSI cross back over the threshold before firing a signal.
There is another identical set of indicators running on a higher time frame (IFTRSI: 4H, BB: D or 3D, TEMA 21 4H) but on the same chart. This tend to generate less signals but are more reliable. A usage example would be to send a larger buy order if the signal comes from this higher time frame, or execute a sell order after multiple buys from the lower time frame.
It comes in 2 parts:
Part A: Contains overlay display. This displays BB, Triple EMA, buy/sell and StochRSI in labels. the labels are self explanatory.
Part B (please search for it): which is actually the same code but contain non-overlay display. You may also put part B overlay=true but scale to LEFT. The advantage of using overlay=true is that you can move the signal right over the candlesticks (mainly for troubleshooting/debugging). This part contains Inverse Fisher RSI, %B, Signal Line. %B is supposedly idential to Bollinger Bands in Part A.
By default, when there is a buy/sell signal:
lower time frame 15m: Signal Line in Part B will turn blue with a value 1 or -1 which corresponds to a buy or sell label in Part A
higher time frame 4H: Signal Line in Part B will turn red with a value 2 or -2 which corresponds to a HTF buy or sell label in Part A
Part A or B may be used to send signal to the webhook. You have to make sure that the settings of Part A and B are identical.
You may choose to un-display some items to reduce clutter.
Current problems:
1. Still too many buy signals
Although many times it will generate excellent buy signal at many swing lows, but there are many buy signals prior to a major swing low. This can be observed in the picture above. It also generate a couple of buy signals prior to the swing lows. I am currently experimenting with 20m and hourly timeframe to address this issue. More filters are needed eg an oscillator or detecting candlestick patterns.
2. Premature sell signals.
The sell signal is often generated at the beginning of a major bull run. My idea to solve this problem is to move to a higher timeframe and sell only when TEMA crossunder the upper bollinger band.
3. Lack of a backtester that can test multiple concurrent deals.
Buy -> Buy (average down) -> Buy (average down) -> Buy (average down) -> Sell
4. Lack of the ability to calculate average purchase price
Probably have to code it as a strategy
5. Display lag
As the browser is running 2 copies of the idential script, it tends to lag when you drag your chart around. So far there are no timeouts or delay in firing alerts to 3commas.
I do welcome any suggestion for improvement and constructive criticism. tqvm.
Credits : Thank you for doing an awesome job. I learnt a lot from your codes and tutorials.
Credits not listed in any order. If your code is used here and did not receive due credit, kindly drop me a note. tq.
Blessing 3 by JTA Today
@ZenAndTheArtOfTrading (extremely-easy-to-understand tutorials eg fixing repainting)
@LazyBear (various codes)
@Galactus-B Argo I
@TheTradingParrot (Inverse Fisher RSI and Gavin's backtester)
@zendog123 (backtester and various codes)
@ydeniz2000 (Bollinger Bands)
TradingView built-in scripts
+ %UMAIf you are familiar with the %B for use with Bollinger Bands, then you will understand this indicator immediately.
Designed for use with my +UMA moving average, this works in exactly the same way, with a few differences.
First off, as you can choose on which type of moving average the calculations are made, so too you will want to match this up with the one you are using. That of course goes for the standard deviation as well (just like you would with Bollinger Bands and %B). Here, because the +UMA uses highs and lows to create a sort of moving average channel, and then also to create the bands, I've opted to set the inner part of the bands as the extreme edge that the %UMA equates with the upper and lower lines.
I've added a moving average, donchian channels, and auto-plotted divergences as well, if you like. Typical color related stuff that I do. Alerts for everything.
Hope you like it!
The above image is comparing two of the same indicator, but based on different moving averages, and how it might plot divergences differently between the two.

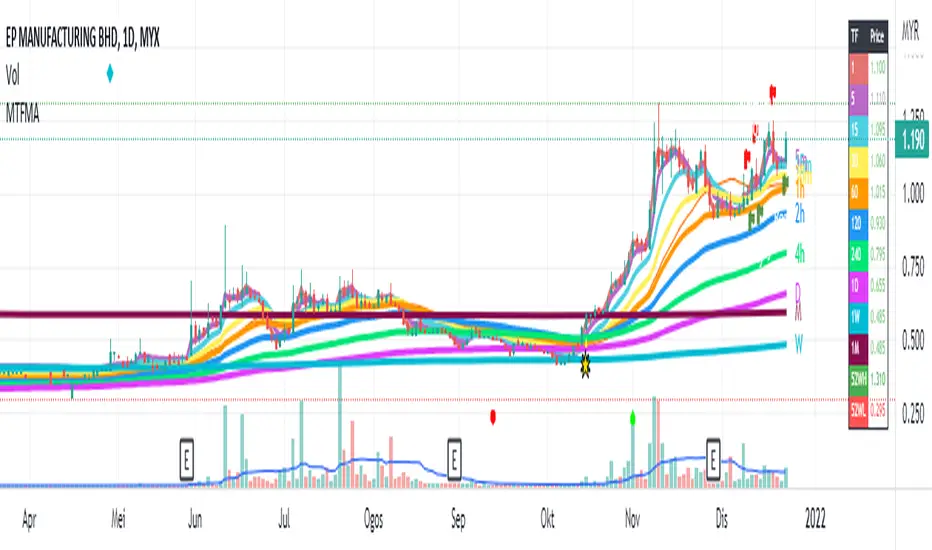
Multiple Timeframe (Moving Average) With InfoThis indicator combine 4 indicator in one pine script : Main indicator is Moving Average in multiple timeframes, Bollinger Band, Crossover Signal, Info Panel, 52Weeks High & 52 Weeks Low.
1)
For multiple moving average, it has 9 difference timeframes.
- Default timeframes is (1minute, 5minutes, 15minutes, 30minutes, 1hour, 4hours, 1Day, 1Week & 1Month). User also have choices to change the option.
- For Moving Average, there also available multiple choice of Moving Average : SMA , EMA , DEMA , VWMA , RMA, WMA . Default Moving Average is EMA (200)
- There also include info panel / table that show TF (Timeframes) for every MAs, & their price. Colors change according to current price. Bullish = Green, Neutral = Neutral, Bearish = Red
There are also function for user to turn on/off :
- (MA) Type & Lenght.
- Multiple MAs.
- Info / Table
User can use multiple line in daily chart to find support & resistance .
Example : For uptrend stock, candle close on top of EMA200 line for 1 hour timeframe. So it's can becomes immediate support, while the other EMAs on below is their next support.
Example :
For downtrend stock, candle close on top of EMA200 line for 5minutes timeframe. So it's become support, while the other EMAs on top is their resistance.
Example :
This Multiple MAs Inspired by xdecow :
www.tradingview.com
Checkout his Multi Timeframe Moving Average here :
2)
This indicator also have Bollingger Band. User have option to turn it on / off. User can use it as a target price if all the EMAs below the candle.
Example :
3)
This indicator also shown 52 Weeks High & 52 Weeks Low. User have option to turn it on / off. Their price also shown at the info panel.
Example :
4)
Crossover Signal. This crossover is default, it happen when candle close on top / near timeframe 5Minutes is (Ready). While candle close below timeframe 5Minutes is (Caution). User can choice other shape if they don't want the text label. To change the crossover for other setup, user can change it under = #2. The crossover only shown in past 10 candle.
Example :
Feel free to use it & comment. Thanks.
Bollinger Band CloudThis script shows a cloud of Bollinger bands of various period lengths surrounding price action.
The bands can be set to 1.25, 2.25 or 3.25 standard deviations.
Functionally, where bands start to converge, especially using 1.25sd, indicates fairly reliable support/resistance. If price action breaks through, price may start trending.
There is also an option to flag price action that breaks through 3.2sd for periods lengths greater than 14. When this happens, watch for a possible stall or reversal.
This concept is merely standing on the shoulders of @acatwithcharts and @dadshark, and I highly recommend using this alongside their indicators. Do yourself a big favor and get to know their work on Advanced Volatility Theory.

Creentrend Pressure SignalsThe hull moving average is my favorite moving average, as well as slower (55ma Bollinger Bands dev@(1.618)) is my favorite standard deviation indicator. Lets combine the two to evaluate overbought, oversold, and pressure.
Use for all time frames- I PREFER daily.
Bollinger band MA at 55
Hull ma at 55
The Hull is more reactive and faster than any band on the BB (both at 55)
When HULL closes BELOW LOWER BAND- it will print a buy signal, remember- over sold and overbought in VOLATILITY could be dangerous on low time frames, as swift moves typically have short term reversals but return to the main trend eventually, this is why i reccomend daily candles.
When PRICE closes ABOVE UPPER BOLLINGER BAND- it will print a green ^ signal under candle indicating upward pressure.
When HULL closes ABOVE UPPER BOLLINGER BAND- it will print a red resistance line. Complex tops happen a lot with bitcoin so take a 1-5% stop above it if shorting.
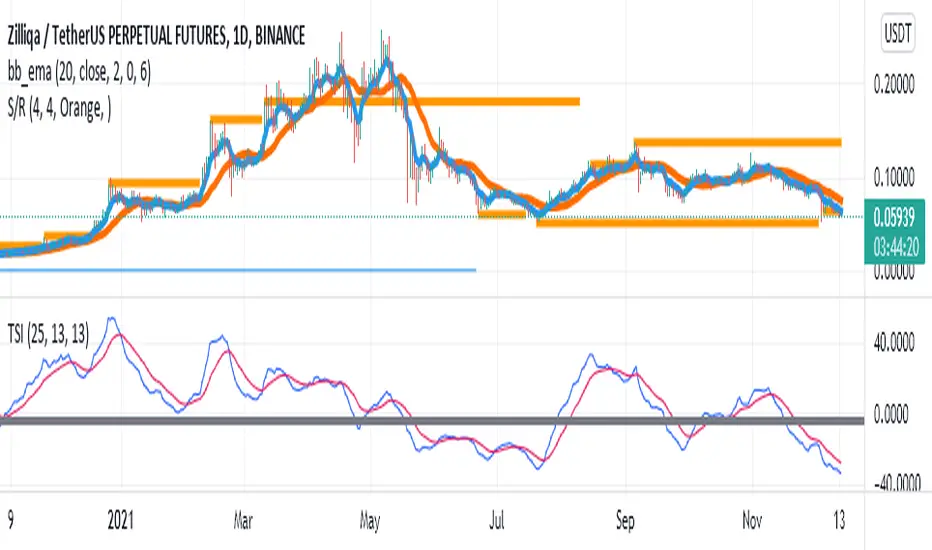
bb_ema_hamedtarkib bb and ema hasttarkib bb and ema hast
tarkib bb and ema hast
tarkib bb and ema hast
tarkib bb and ema hast
tarkib bb and ema hast
tarkib bb and ema hast
tarkib bb and ema hast
tarkib bb and ema hast
tarkib bb and ema hast
tarkib bb and ema hast
tarkib bb and ema hast
tarkib bb and ema hast
tarkib bb and ema hast
Bollinger Bands with Ema and Two DeviationBollinger Bands with Ema calculation. Based on high and low valus of candle. Also can be used two deviation for both upper and lower bands.
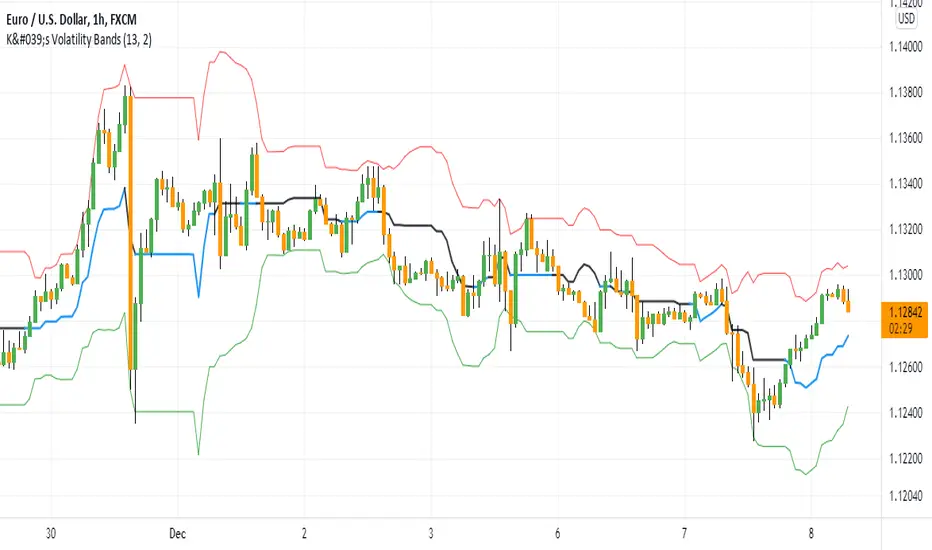
K's Volatility BandsVolatility bands come in all shapes and forms contrary to what is believed. Bollinger bands remain the principal indicator in the volatility bands family. K's Volatility bands is an attempt at optimizing the original bands. Below is the method of calculation:
* We must first start by calculating a rolling measure based on the average between the highest high and the lowest low in the last specified lookback window. This will give us a type of moving average that tracks the market price. The specificity here is that when the market does not make higher highs nor lower lows, the line will be flat. A flat line can also be thought of as a magnet of the price as the ranging property could hint to a further sideways movement.
* The K’s volatility bands assume the worst with volatility and thus will take the maximum volatility for a given lookback period. Unlike the Bollinger bands which will take the latest volatility calculation every single step of time, K’s volatility bands will suppose that we must be protected by the maximum of volatility for that period which will give us from time to time stable support and resistance levels.
Therefore, the difference between the Bollinger bands and K's volatility bands are as follows:
* Bollinger Bands' formula calculates a simple moving average on the closing prices while K's volatility bands' formula calculates the average of the highest highs and the lowest lows.
* Bollinger Bands' formula calculates a simple standard deviation on the closing prices while K's volatility bands' formula calculates the highest standard deviation for the lookback period.
Applying the bands is similar to applying any other volatility bands. We can list the typical strategies below:
* The range play strategy : This is the usual reversal strategy where we buy whenever the price hits the lower band and sell short whenever it hits the upper band.
* The band re-entry strategy : This strategy awaits the confirmation that the price has recognized the band and has shaped a reaction around it and has reintegrated the whole envelope. It may be slightly lagging in nature but it may filter out bad trades.
* Following the trend strategy : This is a controversial strategy that is the opposite of the first one. It assumes that whenever the upper band is surpassed, a buy signal is generated and whenever the lower band is broken, a sell signal is generated.
* Combination with other indicators : The bands can be combined with other technical indicators such as the RSI in order to have more confirmation. This is however no guarantee that the signals will improve in quality.
* Specific strategy on K’s volatility bands : This one is similar to the first range play strategy but it adds the extra filter where the trade has a higher conviction if the median line is flat. The reason for this is that a flat line means that no higher highs nor lower lows have been made and therefore, we may be in a sideways market which is a fertile ground for mean-reversion strategies.
Swing Assassin's Consolidated ScriptI put this script together to essentially consolidate a number of scripts that I use on a daily basis into one script. This is an ongoing improvement effort, so there may be some garbage in here right now so keep that in mind if you intend to use this to help in your trading.
There are 5 moving averages (Hull). I use the Fast, Mid and Slow to find entries after I us the Medium Slow and Super Slow to identify a trend. Otherwise, I have those three turned off.
This script also uses Bollinger Bands which I literally cannot trade without.
The script also has anchored VWAP , automated support/resistance lines, and a homebrewed Volume Profile that is a copy from Ildar Akhmetgaleev's indicator "Poor Man's Volume Profile" used under Mozilla Public License Version 2.0.

Pluto Star - Bollinger Band Trap//DESCRIPTION
//Pluto star appears on a chart when price goes in the in the extreme price range territory, i.e. beyond 2 standard deviation from the mean (or mid Bollinger Band).
//What makes a Pluto Star appear on a chart:
//1. Check if the candle 's' high and low, both are completely outside of the Bollinger Bands (close, 20, 2) - Lets call it Pluto Star Candle
//2. Pluto Star Candle must not be a result of sudden price movement. Hence the previous candle must give a BB Blast.
// In other words, the candle must have it's either open or close outside of Bollinger Bands, to confirm a BB Blast before the Pluto Star
//3. Candle, following the Pluto Star must not break the high (in case of upper BB i.e. short call) or low (in case of lower BB, i.e. long call), to confirm the reversal to the mean
// This implies that Pluto Star appears on chart, above/below the next candle of actual Pluto Star Candle
//----- The above 3 conditions make a Pluto Star appear on a chart. But one must wait for a trade signal. Read the following conditions
//4. There is a signal line, which is nothing but ema(close,5)
//5. The red dotted line is the signal range (and also acts as Stop Loss). The price must close above/below the signal line within the signal range
//6. For a red Pluto Star (short call), the price must close below the signal line, within next 6 candles (signal range). Else there is no trigger for a trade
//7. For a green Pluto Star (long call), the price must close above the signal line, within next 6 candles (signal range). Else there is no trigger for a trade
//8. If any of the candle crosses the Stop Loss line within signal range, there is no trigger for a trade
//9. In a normal scenario, the price must return to the mean, i.e. mid Bollinger Band. In best case scenario, it must go to the opposite side Bollinger Band.
//Recommendation: Test it with Nifty and Bank Nifty charts on 30 mins and 1 hour timeframes

Pin Bar//Pin Bar at the edge of BB
//Conditions to check
// 1. It must be a Pin Bar
// 2. Price Above/Below 200 SMA
// 3. Volume must be above 20 SMA
// 4. Low/High of the Pin Bar must cut across the BB upper/lower band
// 5. The very next candle closes above/below the high/low of the pin bar candle
Recommended timeframe - Daily and Weekly

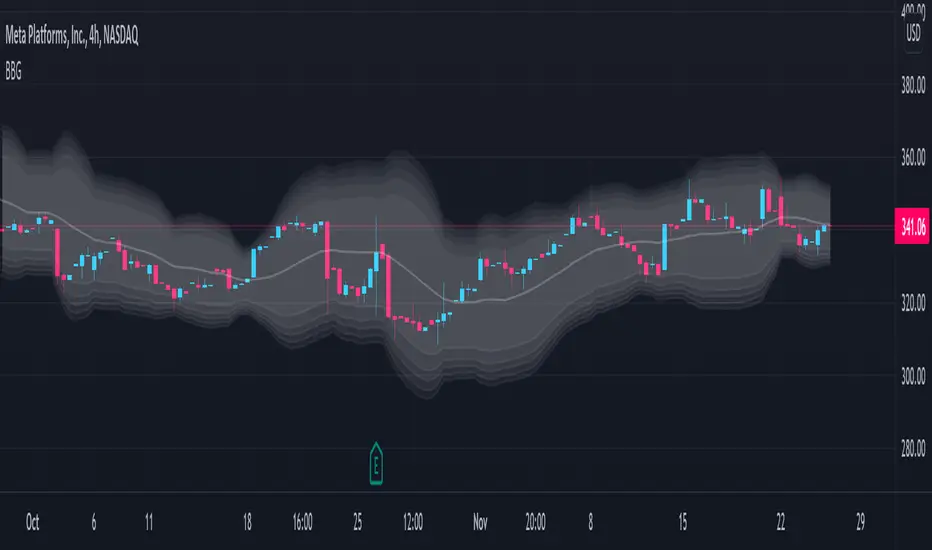
Bollinger Band Gradient (BBG)The Bollinger Band Gradient Indicator uses plenty of Bollinger Bands to create a gradient-looking indicator to help with layered entries . It is similar to a Ribbon but better. This indicator is best used with any volume-related indicator so you can recede from entering into any position with too much momentum to rebound off of any line. Note that this indicator is best used with another strategy like pair trading. It is not recommended to trade based on this indicator only . Please stay aware of any news about the stock you are trading because some events may have a big impact and force the market to go bullish/bearish by a lot. This indicator can be used with all chart types and works well with many other indicators. It allows for complete customization and offers easy-to-understand settings which can be designated to a certain individual. You can modify all settings for the BBs which allows for an even more personalized and adapted Indicator that reflects your trading/ investing needs. You also have the option to choose which type of MAs will be used to create the Bollinger Bands , a few of which include: SMA, EMA, WMA, HMA, RMA, DMA, LSMA, VAMA, TMA, MF.
Bollinger Bands are a way to measure and visualize volatility . As volatility increases, the wider the bands become, and the more they deviate from the basis. Likewise, when volatility decreases, the gap between the bands and basis decreases. Yet a big advantage for not only this but many other indicators is created due to the ample count of different settings that are widely used, it is difficult to view the market through the eyes of all types of investors/traders . This indicator manages to counter exactly this issue, you will be able to see all of these settings on one chart and at one time and enter/exit positions accordingly.
Using this indicator will allow you to visualize entry and exit points with ease and make order layering (buying/selling in layers) much more simple. You can choose a certain amount of Bollinger Bands you would like displayed and customize all technical and style-related settings related to the BBs .
A few of the technical settings you can change for the Bollinger Bands are:
Bollinger Band count (Select how many BBs you want to be displayed.)
MA type used to make the Bollinger Bands ( EMA, SMA, WMA, etc.)
Source (close, open, high, low.)
BB length separately (The length of each Bollinger Band, its lookback. How many previous candles should it be based on? Choose each Bollinger Band's lookback length.)
BB deviator separately(The standard Deviator applied for the BB for both the upper and lower line.)
A few of the style settings you can change for each Bollinger Band are:
Fill (the color used to fill from the upper to the lower band)
Fill opacity % (the opacity used when filling the upper line to the lower line)
This indicator is unique because it can be used for all strategies and all trading styles , for example, day trading or long-term investing, really anything if used correctly. The reason it can be used in so many instances is a result of the detailed and in-depth settings tab that allows for complete customization. This allows the indicator to be used and to be useful in various situations and allows you to dominate the market. Integrated alerts also enhance your efficiency while using this indicator because you can choose to be notified at the crossing of any of the Bollinger Bands.
The technical part of this indicator plots the selected amount of Bollinger Bands using custom-built specified Bollinger Bands accordingly. Then it uses the style settings and styles it as you selected.
Bollinger Band Layer Entry (BBLE) The Bollinger Band Layer Entry Indicator uses plenty of Bollinger Bands to create an onion-looking layered indicator to help with layered entries. It is similar to a Ribbon but better. This indicator is best used with any volume-related indicator so you can recede from entering into any position with too much momentum to rebound off of any line. Note that this indicator is best used with another strategy like pair trading. It is not recommended to trade based on this indicator only. Please stay aware of any news about the stock you are trading because some events may have a big impact and force the market to go bullish/bearish by a lot. This indicator can be used with all chart types and works well with many other indicators. It allows for complete customization and offers easy-to-understand settings which can be designated to a certain individual. You can modify every single factor of the BBs which allows for an even more personalized and adapted Indicator that reflects your trading/ investing needs. You also have the option to choose which type of MAs will be used to create the Bollinger Bands , a few of which include: EMA, SMA, WMA, HMA, RMA, DMA, LSMA, VAMA, TMA, MF.
Bollinger Bands are a way to measure and visualize volatility. As volatility increases, the wider the bands become, and the more they deviate from the basis. Vice versa, when volatility decreases, the gap between the bands and basis decreases. Yet a big advantage for not only this but many other indicators is created due to the ample count of different settings that are widely used, it is difficult to view the market through the eyes of all types of investors/traders. This indicator manages to counter exactly this issue, you will be able to see all of these settings on one chart and at one time and enter/exit positions accordingly.
Using this indicator will allow you to visualize entries with ease and make order layering (buying/selling in layers) much more simple. You can choose a certain amount of Bollinger Bands you would like displayed and customize all technical and style-related settings related to each of the BBs separately.
A few of the technical settings you can change for each Bollinger Band are:
Bollinger Band count (Select how many BBs you want to be displayed.)
MA type used to make the Bollinger Bands (EMA, SMA, WMA, etc.)
Source (close, open, high, low.)
BB length (The length of each Bollinger Band, its lookback. How many previous candles should it be based on? Choose each Bollinger Band's lookback length.)
BB deviator (The standard Deviator applied for the BB for both the upper and lower line.)
Offset
A few of the style settings you can change for each Bollinger Band are:
Upper, Lower, Basis line opacity % (separate for each)
Upper, Lower, Basis line color (separate for each)
Fill (the color used to fill from the upper to the lower band) (separate for each)
Fill opacity % (the opacity used when filling the upper line to the lower line) (separate for each)
This indicator is unique because it can be used for all strategies and all trading styles, for example, day trading or long-term investing, really anything if used correctly. The reason it can be used in so many instances is a result of the detailed and in-depth settings tab that allows complete customization of each separate Bollinger Band. This allows the indicator to be used and to be useful in various situations and allows you to dominate the market. Integrated alerts also enhance your efficiency while using this indicator because you can choose to be notified at the crossing of any of the Bollinger Bands.
The technical part of this indicator plots the selected amount of Bollinger Bands using custom-built specified Bollinger Bands accordingly. Then it uses the style settings and styles it as you selected.

IDEAL BB with MA (With Alerts)It gives well combination of Moving average and Bollinger bands with signals

RSI Rising Crypto Trending AlertAlert version of the strategy with the same name
This is crypto and stock market trending strategy designed for long timeframes such as 4h+
From my tests it looks like it works better to trade crypto against crypto than trading against fiat.
Indicators used:
RSI for rising/falling of the trend
BB sidemarket
ROC sidemarket
Rules for entry
For long: RSI values are rising, and bb and roc tells us we are not in a sidemarket
For long: RSI values are falling, and bb and roc tells us we are not in a sidemarket
Rules for exit
We exit when we receive an opposite direction.
Cuation: Because this strategy uses no risk management, I recommend you takje care with it.
If you have any questions, let me know !

Advanced RSIThis is what I call the advanced RSI. It employs Bollinger bands on the RSI itself, in order to better highlight extremes that are still within the typical 30-70 range on.
You'll notice some background highlights. These are simply to mark the extremes.
Orange marks your standard overbought, Red marks oversold.
Fuchsia marks an RSI outside the lower deviation on the Bollinger Bands. Green marks an RSI outside the upper deviation on the Bollinger bands.
Typically while in an uptrend, the RSI dropping below the lower deviation indicates an entry point (fuchsia). The same applies for a downtrend with the RSI rising above the upper deviation (green).
You can look at the overlap in colors as even stronger indications because on a more rare occasion you will have the RSI outside the upper/lower deviation as well as being outside the typical oversold/overbought levels.
Any feedback is welcome! I try to employ contrasting colors, but they may not make sense to you so change them as you please - they are simply markers.

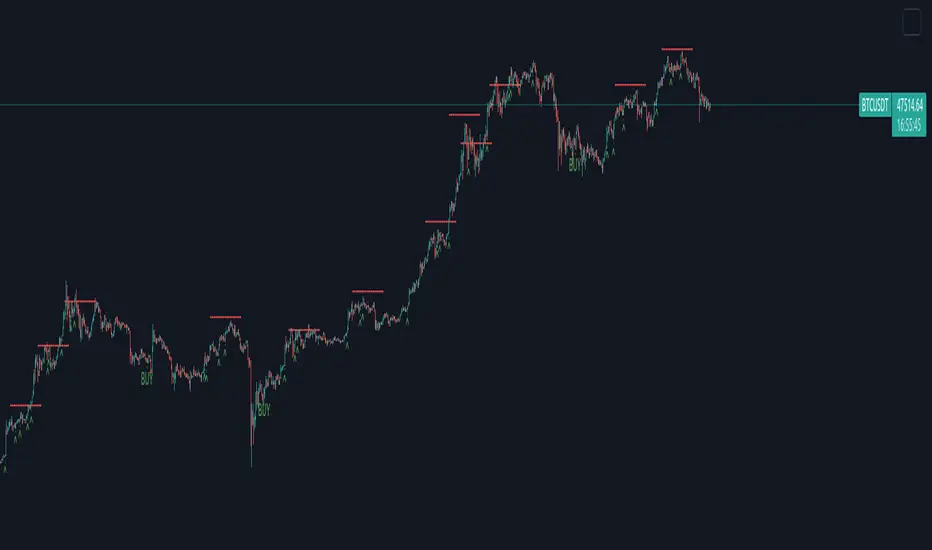
BBW EMA RIBBON+BB%B+EMA BUY/SELL SignalsBINANCE:BTCUSDT
* * * TESTED ON BTCUSDT 4H CHART * * *
The indicator gives signals based on possible ENTRY/EXIT zones (calculated using an ema ribbon of the BBW) and BB%B oversold/overbought conditions, also a 200 EMA filter is used to trade following the major trend.
ENTRY/EXIT zones can be used as a confirmation on other strategies (green zones suggest a possible entry for a long in an uptrend and for a short in a downtrend, red zones suggest a possible exit for long & short)
Only LONG signals are given.
Signals are divided in 3 categories based on their strenght:
- Weak BUY/SELL (green/red circles on chart)
- normal BUY/SELL (green/red triangles with "BUY" or "SELL" text on chart)
- strong BUY/SELL (green/red labels with "STRONG BUY" or "STRONG SELL" text on chart)
You can use signals from the same category as triggers for entering or exiting a trade or you can try using signals from different categories
All indicators settings can be costumized
Possible EXTRY/EXIT zones can be turned ON/OFF
Every signal label can be turned ON/OFF
EMA that changes color based on last candle close can be turned ON/OFF
Alerts can be set for:
- General Signals (every signal will trigger it)
- Weak Signals (only weak signals will trigger it)
- Normal Signals (only normal signals will trigger it)
- Strong Signals (only strong signals will trigger it)
There are 3 BB%B Oversold & 3 BB%B Overbought value presets:
- BASIC (default values)
- LOW (slightly lower values from default)
- HIGH (slightly higher values from default)
Tips:
Use BB%B OS LOW preset to find entries at a better price
Use BB%B OS HIGH preset to find entries faster
Use BB%B OB LOW preset to find exits faster
Use BB%B OB HIGH preset to find exits at a better price
There are 3 Filters already included:
- A checkbox to toggle ON/OFF the use of Heikin Ashi candels to detect trades
- A checkbox to toggle ON/OFF the use of an ema filter for the ribbon that tries to reduce the number of false signals on over-extended price movements
- A checkbox to toggle ON/OFF the use of an ema filter that tries to reduce the number of false signals when price crosses the moving average many times consecutively

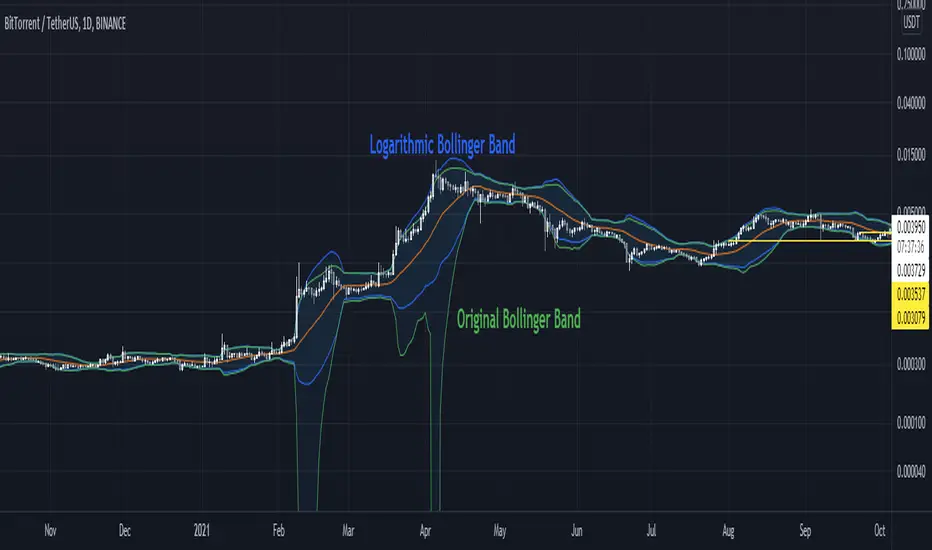
Logarithmic Bollinger BandsThe existing Bollinger Bands simply used price to derive the standard deviation.
In other words, whether an asset goes up or down by $50 from $100, it counts at the same "50$".
But in the asset market, an increase of $50 and a fall of $50 have different values.
To eliminate this difference using a logarithmic function, a new Bollinger Band was created.
Green is the original Bollinger Band.
As mentioned above, a sharp lower band is formed by calculating the rise and fall of an asset with the same value.
Blue is the Logarithmic Bollinger band.
Please make this indicator useful!
기존의 볼린저 밴드는 단순하게 가격을 이용해 표준편차를 도출해내었습니다.
즉 자산이 100$에서 50$이 오르든 내리든 같은 "50$"로 계산한 것입니다.
하지만 자산시장에서 50$이 오르는 것과 50$이 내리는 것은 다른 가치를 가집니다.
이 차이를 로그함수를 이용해 없애보고자 하였고, 새로운 볼린저밴드를 만들었습니다.
초록색이 기존의 볼린저밴드입니다.
위에서 말했듯이 자산의 오르내림을 같은 가치로 계산해서 급격한 아래 밴드가 형성됩니다.
파란색이 로그 볼린저밴드입니다.
이 지표를 유용하게 사용해주세요!
ViVen-Multi Time Frame Bollinger Band StrategyThis indicator created to identify the strong Support and Resistance levels based on the Bollinger Bands. When two different time frame Bollinger Bands are travelling together then its a strong Support or Resistance Levels.
I have added 5 Min, 15 Min, 30 Min, 1 Hr and 1 Day time frame Bollinger Bands in one Chart. You can select and combine whichever the TF you want.
Default values considered - Period - 20 and Std.Dev is 2
You can on/off the indicator based on the requirement.
Trade plan:
BUY - When price comes near to the Bottom Bollinger Band level (look for candle confirmation is plus). If multiple Bollinger bands travels together then is Strong Support. (Exit if Price Breaks down the BB)
SELL - When price reaches the Upper Bollinger Band level (look for candle confirmation is plus). If multiple Bollinger bands travels together then is Strong Support. (Exit if Price Breaks Up the BB)
Middle Line - is the 20 SMA line
When the Gap between Upper and Lower Band is narrow then we can expect a trending movement soon.

Bollinger bands and Keltner bands
█ OVERVIEW
This is a Bollinger band Script, with Keltner Channel Bands and for scalping.
█ CONCEPTS
1 — Bollinger Bands, The Bollinger band component is make out from two part, the standard component represented by a white cloud.
This is the 2nd deviation and 3rd deviation filled.
The second part linear weight
This is the 2nd deviation, and is filled from the 3rd deviation from the standard bands. This give the effect of cutting in and out to proved a support and resistance cloud.
2 — Keltner bands, this is the normal calculation, nothing special, by default this is off and can be turned back on in styles.
3 Deviations with ALMA as the Basis
3 — Non-traditional basis
Like with you can change the base moving average
but to a lesser extent.
option are:
sma = Simple Moving Average
ema = Exponential Moving Average
wma = Weighted Moving Average
vwma = Volume Weighted Moving Average
rma = Running Moving Average
alma = Arnaud Legoux Moving Average
hma = Hull Moving Average
█ OTHER SECTIONS
• LIMITATIONS: again this is base on moving average so there is a lag factor, the cloud do not work without volume so if the indicator can not pull volume data you are left with the standard bands.
• NOTE this is a trimmed version of still functions the same.
• THANKS: rumpypumpydumpy for the inspiration

BB+RSI+EMA BUY/SELL SignalsBINANCE:BTCUSDT
* * * TESTED ON BTCUSDT 4H CHART * * *
The indicator gives signals based on candles touching BB lines and RSI oversold/overbought conditions, also a 200 EMA filter is used to trade following the major trend.
Only LONG signals are given.
Signals are divided in 3 categories based on their strenght:
- Weak BUY/SELL (green/red circles on chart)
- normal BUY/SELL (green/red triangles with "BUY" or "SELL" text on chart)
- strong BUY/SELL (green/red labels with "STRONG BUY" or "STRONG SELL" text on chart)
You can use signals from the same category as triggers for entering or exiting a trade or you can try using signals from different categories
All indicators settings can be costumized
Every signal label can be turned ON/OFF
EMA that changes color based on last candle close can be turned ON/OFF
Alerts can be set for:
- General Signals (every signal will trigger it)
- Weak Signals (only weak signals will trigger it)
- Normal Signals (only normal signals will trigger it)
- Strong Signals (only strong signals will trigger it)
