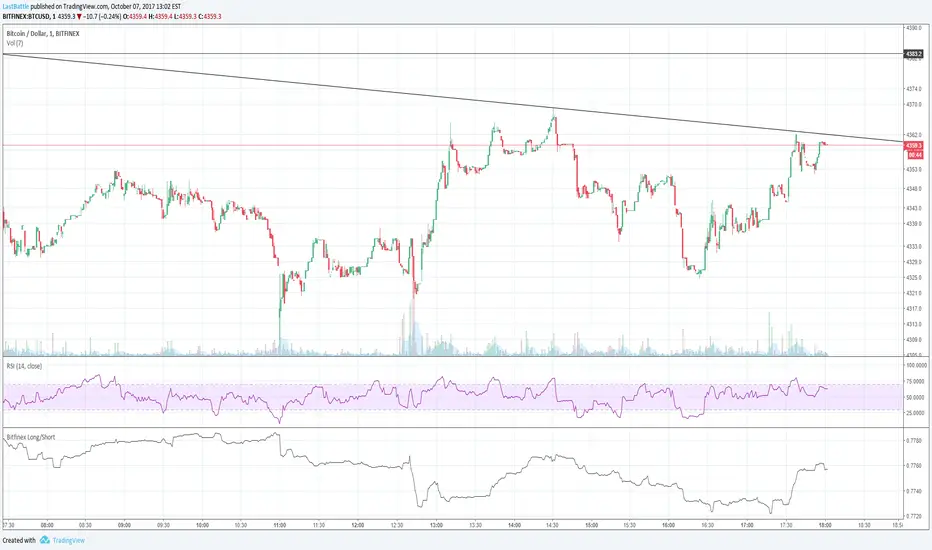
Bitfinex BTC longs vs Short ratioSelf explanatory...
Shows the long / short ratio of trader's positioning in bitfinex exchange.
The higher the ratio, it means there are more longs. The lower the ratio, the more shorts are currently being opened,.
Configurations Haussières
CandleCheckThis indicator is intended to evaluate the quality of the bullish candles (close > open).
It will calculate the average size of the bullish candles from the last 200 periods. I'm assuming that a bullish candle with a superior wick or shadow equal or less than 25% of the total size of the bar is a good disruption candle. You can adjust at your own taste.
Candles with a size above the average and a superior wick or shadow equal or less than 25% of the total size of the bar will be painted lime. These are "good" candles.
Candles with a superior wick or shadow equal or less than 25% of the total size of the bar but with a size below the average will be painted green. These are "OK" candles.
Candles with a size above the average but a superior wick or shadow above than 25% of the total size of the bar will be painted fuchsia. These are "bad" candles.
Candles with a size below the average and a superior wick or shadow above than 25% of the total size of the bar will be left alone. These are "worse" candles.
"bad" and "worse" candles will be marked with a lime cross at the exact spot where price should reach to turn these candles to "OK" or "good". That value will be indicated at the indicator header.
"OK" or "good" candles should have a volume above the average.

Confluence Strategy This is modified version of Dale Legan's "Confluence" indicator written by Gary Fritz.
================================================================
Here is Gary`s commentary:
Since the Confluence indicator returned several "states" (bull, bear, grey, and zero),
he modified the return value a bit:
-9 to -1 = Bearish
-0.9 to 0.9 = "grey" (and zero)
1 to 9 = Bullish
The "grey" range corresponds to the "grey" values plotted by Dale's indicator, but
they're divided by 10.

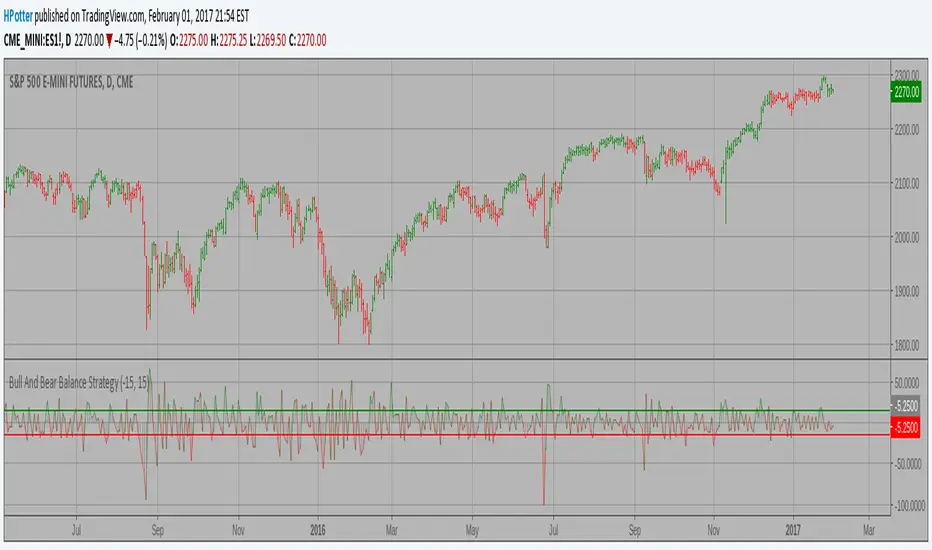
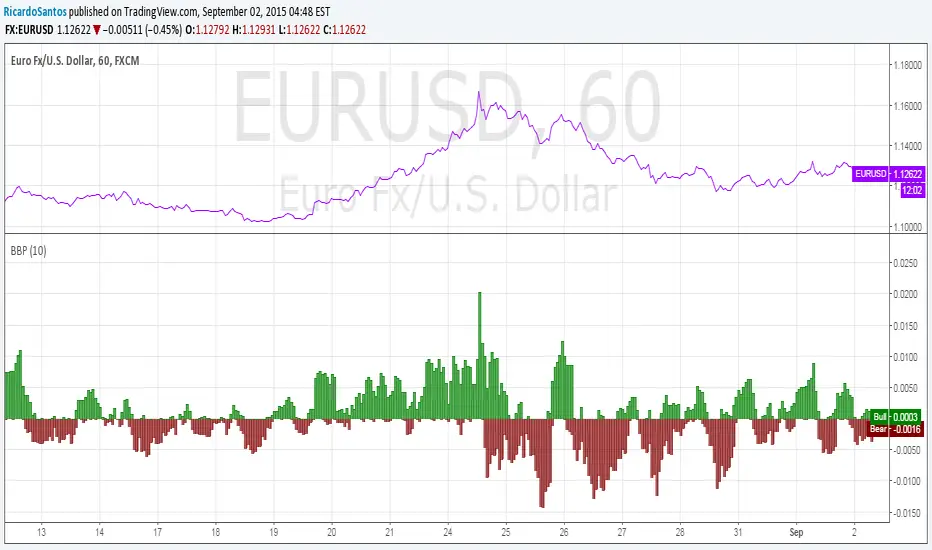
Bull And Bear Balance Strategy This new indicator analyzes the balance between bullish and
bearish sentiment.
One can cay that it is an improved analogue of Elder Ray indicator.
To get more information please see "Bull And Bear Balance Indicator"
by Vadim Gimelfarb.
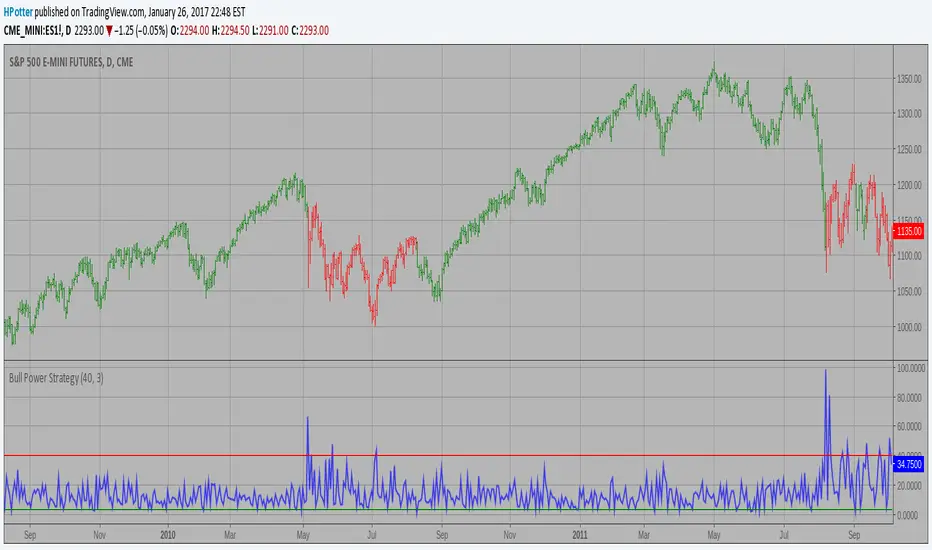
Bull Power Strategy Bull Power Indicator
To get more information please see "Bull And Bear Balance Indicator"
by Vadim Gimelfarb.
Bear Power Strategy Bear Power Strategy
To get more information please see "Bull And Bear Balance Indicator"
by Vadim Gimelfarb.

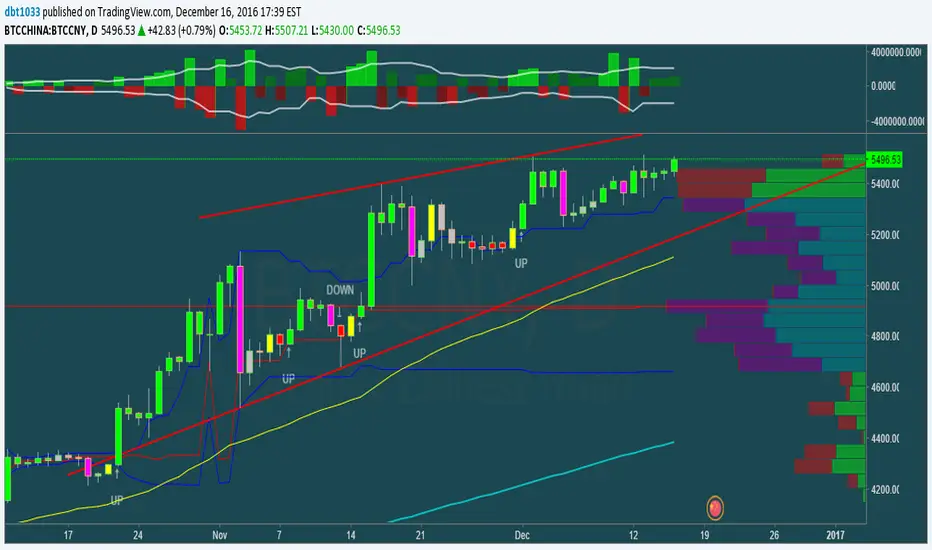
1337 VolumeThis volume indicator gives you a unique perspective and ability to analyze volume in any market. The upper line that is always >=0 represents average up volume over a user definable period while the lower line that is always <= 0 represents the average down volume over a user definable period.
green == bullish candle but volume lower than average
lime == bullish candle with above average volume
crimson == bearish candle with below average volume
red == bearish candle with above average volume
This indicator is very useful for spotting bottoms / tops (do a visual backtest and observe its behavior) as well as entry opportunities.
By default, the lookback period for average volume is 7, but I encourage you to change this value in order to find settings that work best for your particular market.
If you have any feedback or ideas for improvement, please comment.
Enjoy :D

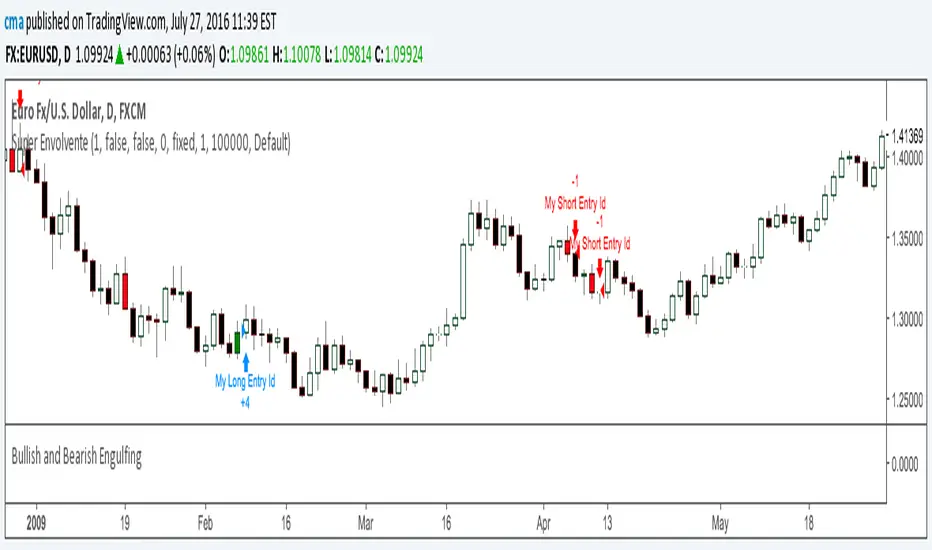
Bullish and Bearish EngulfingIndicator that changes the bar's color to green if there is a Bullish Engulfing or Red if there a Bearish Engulfing Patterns.

Bullish and Bearish EngulfingIndicator that changes the bar's color to green if there is a Bullish Engulfing or Red if there a Bearish Engulfing Patterns.
[RS]Linear Regression Bull and Bear Power Accumulation V1EXPERIMENTAL:
Bull and Bear power based on linear regression (this is a non lagging oscillator, the parameter are for the lookup window for the donchian extremes)
this indicator can also be used for convergence/divergence.
(accidentjev2) added multi timeframe support (indicator may repaint values)

[NM] EMADiff v01 - an indicator for everyone !Allright gang, we are here with a new indicator that should help you with determining the direction to trade or whether you should trade at all.
It uses the close of the candle and 2 EMAs.
The faster moving line is the difference between the close and the Slow EMA, while the slower moving line shows the difference between the Fast EMA and the Slow EMA.
There are a couple of ways you can use this indicator, depending on your trading style :
For the quick profit, in and out :
- enable the safer trading option and keep smoothing at the default setting, buy when both lines are green, sell when both line are red and get out when one of the lines changes color (or when profit target is reached) (see the top option)
For longer trades :
- you can increase the smoothing, use a higher Slow EMA and disable the Safer trading option, enter either when both lines have the same color, either on a crossover. (the bottom option)
In both cases, if both lines hover around the zero line, the trend is definitely not strong.
Much more options are available so I would love to hear how you use this indicator. A thumbs up if you like it would be highly appreciated :)
Works nicely together with my other indicators below :
To add this indicator (or any other) to your chart, click the "Add to favorites" button. Then while having the chart you wish to apply it to open, click on Indicators > Favorites > EMADiff v01 (or any other indicator that you favorited.

[RS]Linear Regression Bull and Bear Power V0EXPERIMENTAL:
Bull and Bear power based on linear regression (this is a non lagging oscillator, the parameter are for the lookup window for the donchian extremes)
this indicator can also be used for convergence/divergence.
Vdub_BinaryBands_v1Combined 3 x Bollinger Bands With BUY & SELL zones
EMA,
Wma
SMA
Multiplier adjustment

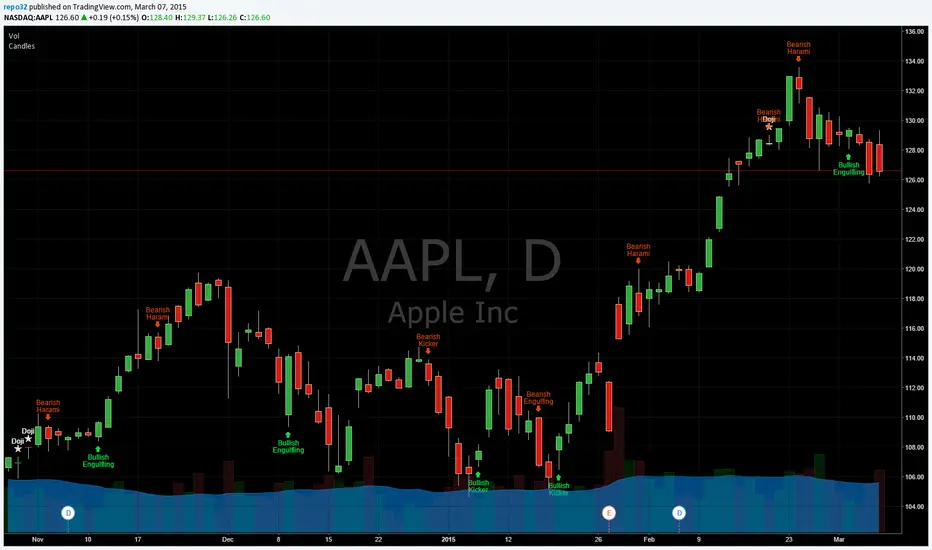
Candlestick Patterns Identified (updated 3/11/15)I decided to republish this one without the trend filter and with all the major symbols active. This will allow for all the patterns to show up.
Due to 15 different candlestick formations in this one script, it will be difficult to turn off the last few due to screen size. You can turn off individual patterns on the settings screen.
I have everything spelled out except the hammer and inverted hammer. They are "H" and "IH" respectively on the charts. They show up so often that they cluttered the charts.
The default script has: Doji, Evening Star, Morning Star, Shooting Star, Hammer, Inverted Hammer, Bearish Harami, Bullish Harami, Bearish Engulfing, Bullish Engulfing, Piercing Line, Bullish Belt, Bullish Kicker, Bearish Kicker, Hanging man, and Dark Cloud Cover. You can turn off what you don't like. The Piercing Line, Bullish Belt, and the Kickers will usually show up better in the daily charts.
I recommend watching videos with Stephen Bigalow to get a feel for how to trade these. You will want to add an 8 EMA to your chart with his setups. Enjoy.
If you want the old version: Take a look at the related ideas below.

Candlesticks Patterns IdentifiedI was using another script that colored the bars to show the different candle patterns. Thanks to HPotter (www.tradingview.com). Unfortunately, I can't think that fast when looking across a screen of charts with different color bars. Fortunately, Tradingview came up with symbols and names on 2/26/15. I decided to take my favorite symbols and attach them to a name. This makes it easier to see what is going on and where your entry would be if it confirms. Works beautifully for me. Decided to share. I also added the ability to alter what shows up based upon a look back. A bullish engulfing at the top of a trend, or a bearish harami at the bottom of the trend, is nearly useless and clutters the chart. I have the default set for the open of the current bar to be higher or lower than the open from 5 bars back. You can adjust in the settings to what you like. This trend setting is on all the patterns except doji. If you want to see all the candle patterns, set it to "1".
The doji can be adjusted as well. I left some other patterns at the bottom of the script, but they are turned off. They became too much of a clutter for me. I prefer DovCaspi's pattern finder for hammers and stars: I use his due to the clean appearance.
The default script has: Doji, Bearish Harami, Bullish Harami, Bearish Engulfing, Bullish Engulfing, Piercing Line, Bullish Belt, Bullish Kicker, and Bearish Kicker. You can turn off what you don't like. The Piercing Line, Bullish Belt, and the Kickers will usually show up better in the daily charts.
If you would like the updated version, see the Related Ideas below:
ET/CandleStick-2website: www.ersoytoptas.com
Newspaper : tr.investing.com
Bullishharami , Bearishharami , hangingman
Analysis First, you are building your own, then use Indicator ..
Thank you

Elder Ray Composite DOA hybrid representation of Elder Ray's Bear/Bull as an oscillator, using TEMA and LRC calculations to average out the signals. The Oscillation is based off of the Derivative oscillator. This gives an interesting interpretation of Bear vs Bull power. Give it a try!

Madrid Bull/Bear TerritoryThis study displays a background in four colors, lime, green, red, maroon, lime = Bull Territory, red = Bear Territory, green = possible reversal to Bear Territory, maroon = possible reversal to Bull Territory.
Trading with the basic rule, go long on a Bull Market and short a Bear Market.
This study can be used inside the main window, or by unmerging/merging it can be used as a standalone or in combination with other indicators.
The parameters defined by default reduce choppiness and false signals, but just like any other indicator, there is a trade off between fast response and choppiness. The smaller the parameters the faster response, but the more choppiness.
This indicator is built using three EMA's, two (the bigger ones) are used to define the trend direction, and the fastest one is used as a signal, when the signal breaks out the trend indicators to the downside we're in Bear Market, when the signal breaks out to the upside, we're in Bull Market, any thing in between is either a trend reversal or trend continuation.
Momentum indicators and price pattern analysis are recommended to determine the direction of the trend.

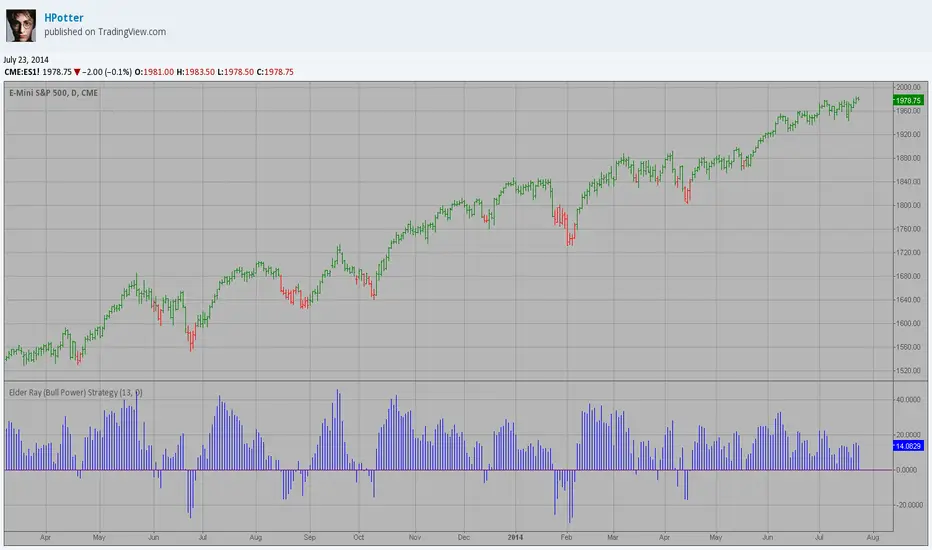
Elder Ray (Bull Power) Strategy Developed by Dr Alexander Elder, the Elder-ray indicator measures buying
and selling pressure in the market. The Elder-ray is often used as part
of the Triple Screen trading system but may also be used on its own.
Dr Elder uses a 13-day exponential moving average (EMA) to indicate the
market consensus of value. Bull Power measures the ability of buyers to
drive prices above the consensus of value. Bear Power reflects the ability
of sellers to drive prices below the average consensus of value.
Bull Power is calculated by subtracting the 13-day EMA from the day's High.
Bear power subtracts the 13-day EMA from the day's Low.
You can use in the xPrice any series: Open, High, Low, Close, HL2, HLC3, OHLC4 and ect...
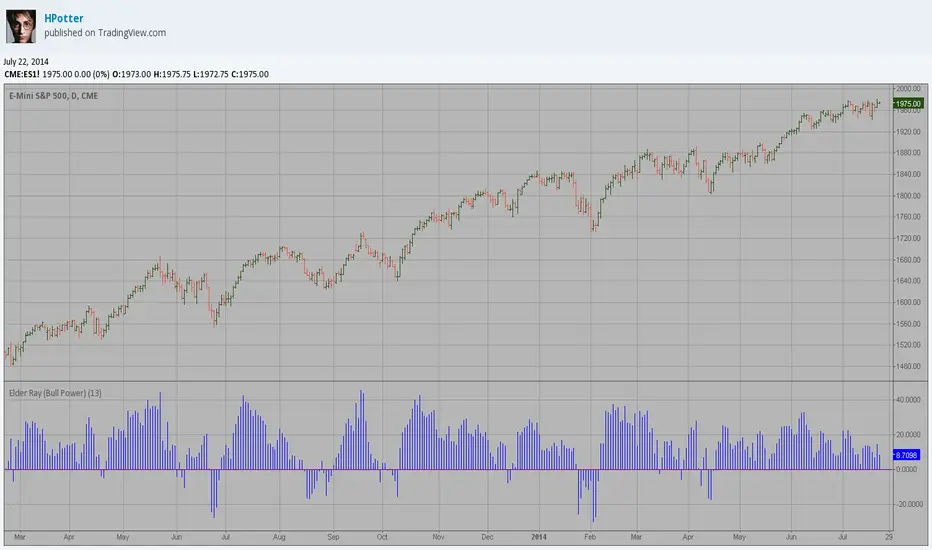
Elder Ray (Bull Power) Developed by Dr Alexander Elder, the Elder-ray indicator measures buying
and selling pressure in the market. The Elder-ray is often used as part
of the Triple Screen trading system but may also be used on its own.
Dr Elder uses a 13-day exponential moving average (EMA) to indicate the
market consensus of value. Bull Power measures the ability of buyers to
drive prices above the consensus of value. Bear Power reflects the ability
of sellers to drive prices below the average consensus of value.
Bull Power is calculated by subtracting the 13-day EMA from the day's High.
Bear power subtracts the 13-day EMA from the day's Low.
You can use in the xPrice any series: Open, High, Low, Close, HL2, HLC3, OHLC4 and ect...
Bull And Bear Balance Indicator Hi
Let me introduce my Bull And Bear Balance Indicator script.
This new indicator analyzes the balance between bullish and
bearish sentiment.
One can cay that it is an improved analogue of Elder Ray indicator.
To get more information please see "Bull And Bear Balance Indicator"
by Vadim Gimelfarb
