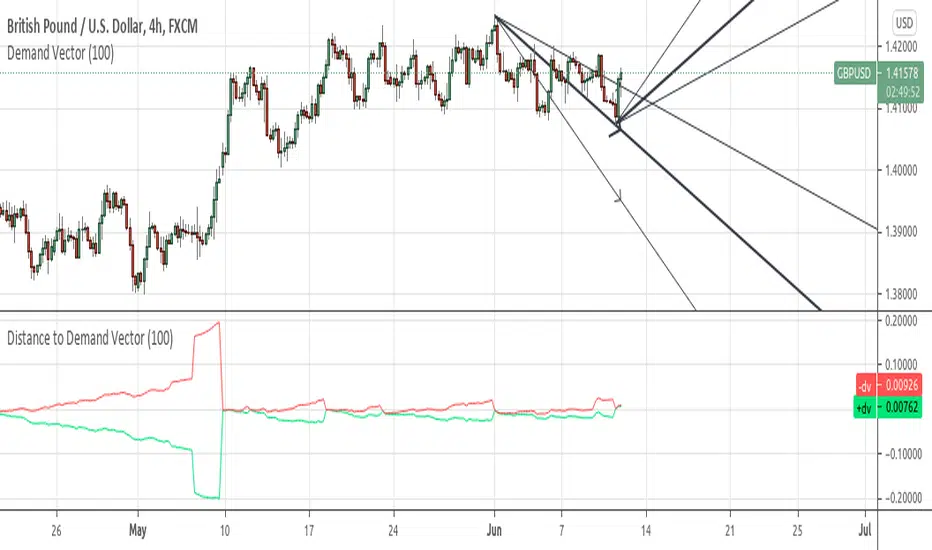
RedK Slow_Smooth Average (RSS_WMA)RedK Slow Smooth Average (RSS_WMA) is based on simple, multi-WMA passes to generate a moving average that sacrifices low-lag and fast responsiveness for the sake of smoothness.
This smoothness enables an increased trader ability to visualize and track longer-term trends and removes the noise of smaller, relatively insignificant price fluctuations.
Notes:
=========
* RSS_WMA is deliberately built to be a "lazy line" - and it works in a different way to other common moving averages that attempt
Indicateurs et stratégies
Financials on Chart█ OVERVIEW
This indicator displays your choice of up to 9 fundamentals on your chart.
█ FEATURES
You can configure the following attributes of the display:
• Its position on your chart.
• Automatic or custom height and width of rows.
• The size and color of text.
• The default background color (you can override it with a custom color for individual values).
• Conversion of values expressed in USD to one of the major currencies. Financials are normally expressed in quote currency.
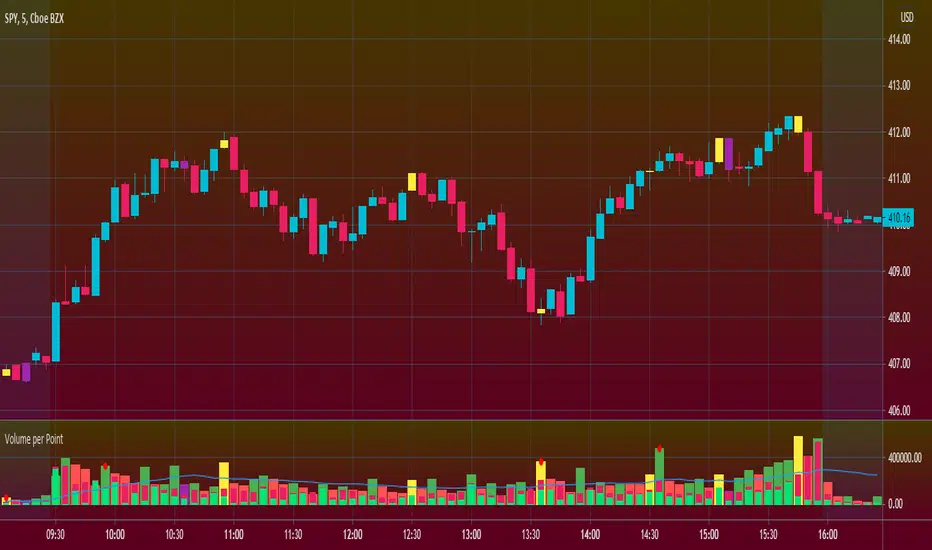
Volume per PointHello everyone <3
I present to you guys my new indicator Volume per Point (VP)
As suggested by the title, this script gives you the volume for every point.
Here's a run down on specific features:
SUBCHART COLUMNS:
The columns can be the following four colors:
Green - There was an increase in VP
Red - There was a decrease in VP
Yellow - There was divergence between volume and candle range
Purple - There are signs of exhaustion compared to the previous candlestick
SUBCHART HISTOGRAM:
Cup FinderHello All,
This script finds the Cups and you can use it while analysing the symbols. it creates circle and channel for the potential Cups and checks the number of bars included by the channel, if included bars is equal or greater than the value you set then it shows the cup.
The Options:
"Number for Bars to search" : Maximum length of a Cup
"Channel Width of the Cup" : Tate by the channel width of highest/lowest levels in last 300 bars, by default it's 5%
"Check for Breakout" : if the
Outlier Detector with N-Sigma Confidence IntervalsA detrended series that oscilates around zero is obtained after first differencing a time series (i.e. subtracting the closing price for a candle from the one immediately before, for example). Hypothetically, assuming that every detrended closing price is independent of each other (what might not be true!), these values will follow a normal distribution with mean zero and unknown variance sigma squared (assuming equal variance, what is also probably not true as volatility changes over time for d
RedK Compound Ratio Moving Average (CoRa_Wave)
Compound Ratio Weighted Average (CoRa_Wave) is a moving average where the weights increase in a "logarithmically linear" way - from the furthest point in the data to the current point - the formula to calculate these weights work in a similar way to how "compound ratio" works - you start with an initial amount, then add a consistent "ratio of the cumulative prior sum" each period until you reach the end amount. The result is, the "step ratio" between the weights is consistent - This is not the
Detrended Rhythm Oscillator (DRO)How to detect the current "market beat" or market cycle?
A common way to capture the current dominant cycle length is to detrend the price and look for common rhythms in the detrended series. A common approach is to use a Detrended Price Oscillator (DPO). This is done in order to identify and isolate short-term cycles.
A basic DPO description can be found here:
www.tradingview.com
Improvements to the standard DPO
The main purpose of the standard DPO is to analyze historical data in orde
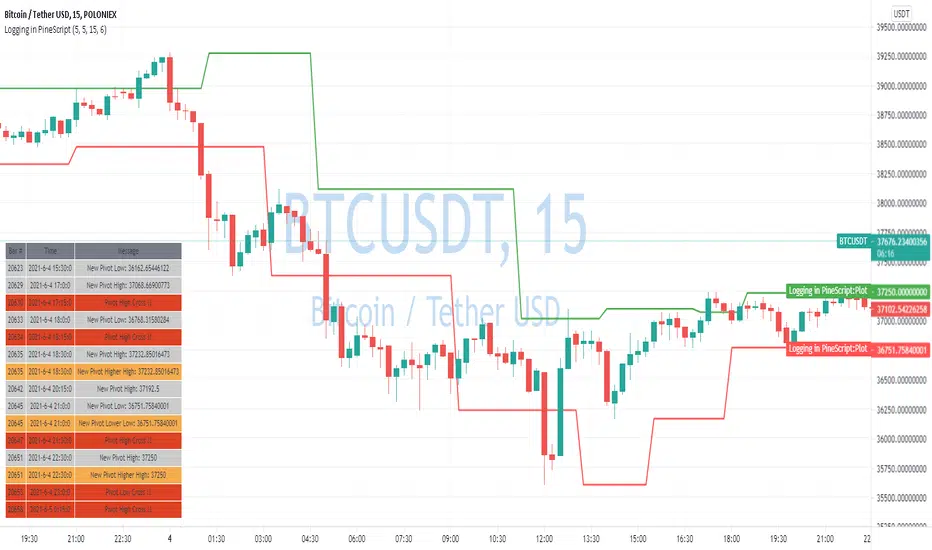
Logging in Pine ScriptI'm building quite a lot of pretty complicated indicators/strategies in Pine Script. Quite often they don't work from the 1 try so I have to debug them heavily.
In Pine Script there are no fancy debuggers so you have to be creative. You can plot values on your screens, check them in the data window, etc.
If you want to display some textual information, you can plot some info as labels on the screen.
It's not the most convenient way, so with the appearance of tables in Pine Script, I decided
Technical Ratings on Multi-frames / Assets█ OVERVIEW
This indicator is a modified version of TECHNICAL RATING v1.0 available in the public library to provide a quick overview of consolidated technical ratings performed on 12 assets in 3 timeframes.The purpose of the indicator is to provide a quick overview of the current status of the custom 12 (24) assets and to help focus on the appropriate asset.
█ MODIFICATIONS
- Markers, visualizations and alerts have been deleted
- Due to the limitation on maximum number of security (40), the
3D Wave-PMThe Wave-PM (Whistler Active Volatility Energy - Price Mass) indicator is an oscillator described in Mark Whistler's book 'Volatility Illuminated'.
The Wave-PM was specifically designed to help read cycles of volatility. When visualizing volatility cycles as a heatmap we can get a clear overview of market volatility phases on multiple timeframes, and more importantly as traders give us insight into 'potential' volatility from to pent up energy signaled by the blue and green plumes which invaria
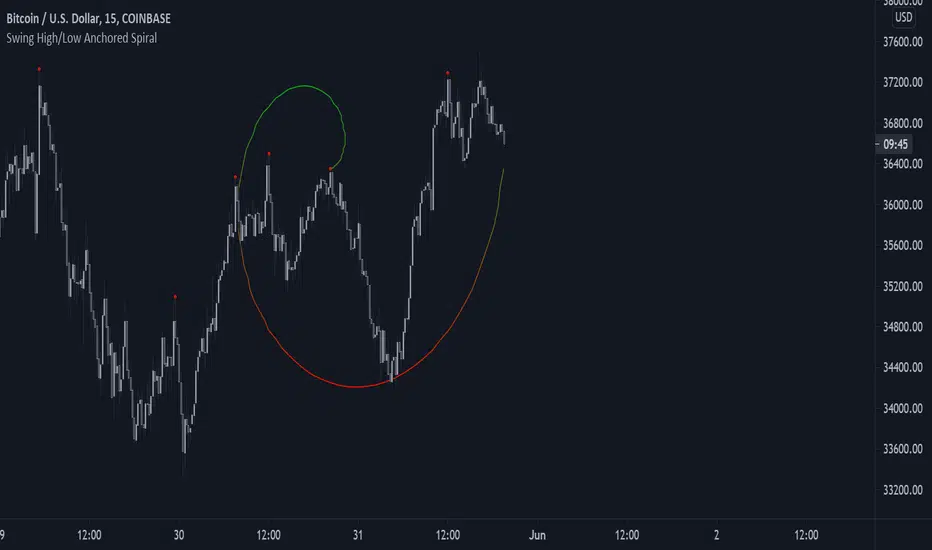
Swing High/Low Anchored SpiralFit the estimate of an Archimedean spiral to the price, with a central point determined by swing high/lows.
Users can determine which historical swing high/low to use as the spiral central point and can choose the number of turns it should make.
You can create cool shapes, cool enough to satisfy your apophenia needs.
If you are having issues just hide and unhide the script, or just lower the length/occurrence setting.
Posting is impossible without the support of my Patreons as w
Quality ScreenAn attempt to show fundamental stats which describes quality of the stock. Following parameters are depicted:
SOLVENCY
DEBT_TO_EQUITY
Very Good : 0 - 1
Good : 1 - 2
High risk : > 2
DEBT_TO_ASSET
Very Good : < 0.4
Good : 0.4 - 0.6
High Risk : > 0.6
LONG_TERM_DEBT_TO_ASSETS
Very Good : < 0.4
Good : 0.4 - 0.6
High Risk : > 0.6
ALTMAN_Z_SCORE
Very good: > 3
Good : 1.8 - 3
High Risk : < 1.8
SPRINGATE_SCORE
High Risk : < 0.862
LIQUIDITY
CURRENT_RATIO
Ver
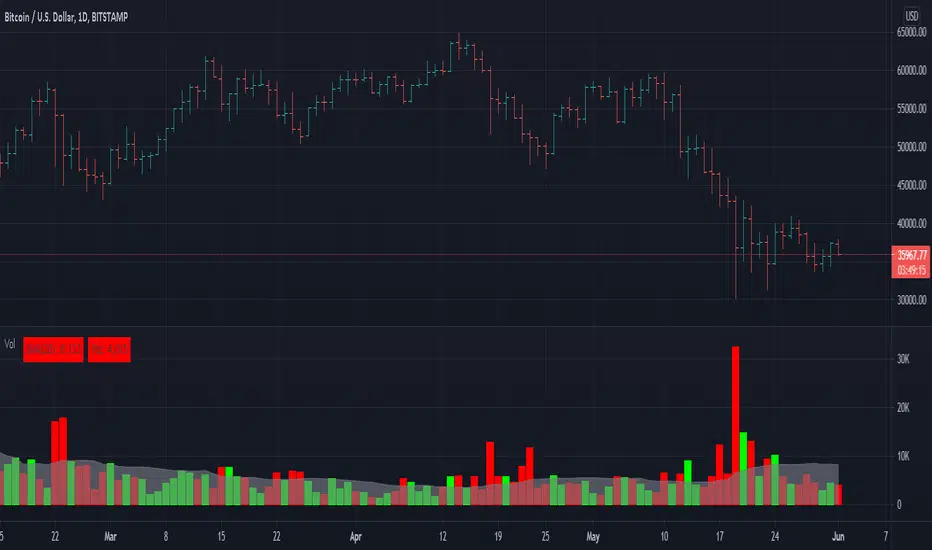
Adapting a built-in [PineCoders]█ OVERVIEW
This Pine script shows how it can be quite simple to personalize a built-in indicator for your needs.
█ OUR SCRIPT
Our objective was to add the current values for volume and its moving average in prominent view, and use brighter colors than the built-in.
We started with the source code from the "Volume" built-in indicator. You can access the source code of many built-ins from the Pine Editor by clicking the "Open" button and choosing "New default built-in script..."
We chan
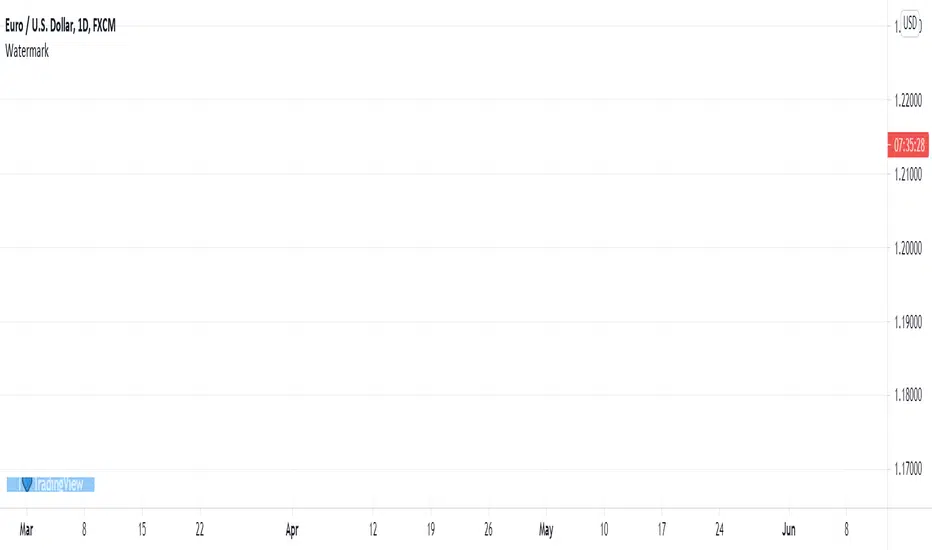
WatermarkLook in the lower-left corner of this chart. If you load the script on your chart, you will see how the watermark animates. You can personalize it in the script's "Settings/Inputs" tab to use it in your chart snapshots.
Do keep in mind that if you use it when publishing ideas, videos or scripts, House Rules prohibit advertising on your chart.
For Pine coders
This script uses our new table feature in Pine to position a watermark on the chart, and the new varip type of variable to animat
Chart OscillatorI present you the chart oscillator where an oscillator (Stoch or RSI) is plotted
on the chart itself (instead of below the chart)
It is inspired on an idea of @Kablamicus
Instead of having the lines between 0 and 100, here the '0-100' are
- lowest(low, len)
- highest(high, len)
An overbought/oversold and a middle line is derived from these lines
and the oscillator goes in between.
It resembles very much the 'normal' oscillator, with a few extra's:
- you can see the movement of the candles ag
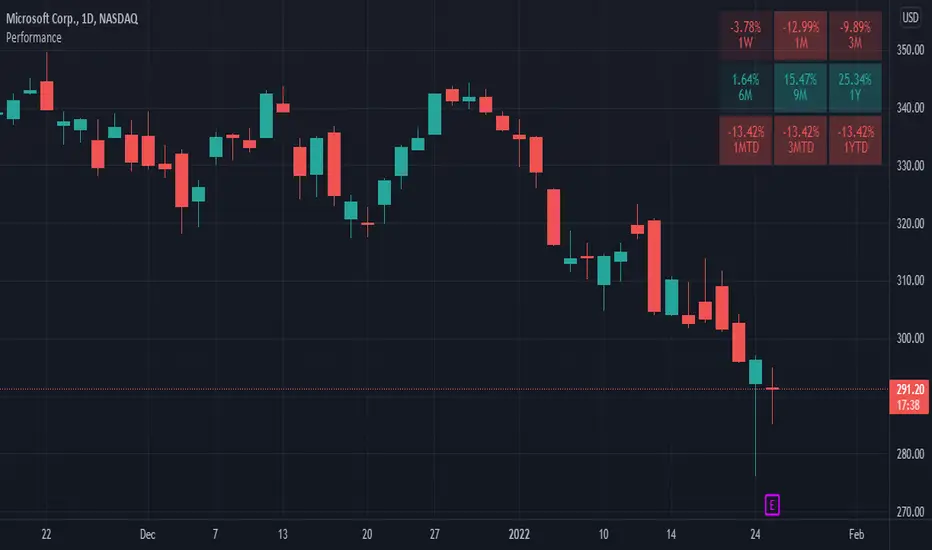
Performance TableThis indicator is based on the Performance section in the TradingView's sidebar and uses new Pine tables functionality. It compares the current price of the symbol to its past price and calculates the rate of return to make it easier to track the performance of the symbol. Note that the Performance sidebar is not updated in real-time, while this indicator is, so on real-time charts the values between the two can differ (the indicator's values are more recent).
The formula of the calculation is
Realtime Delta Volume Action [LucF]█ OVERVIEW
This indicator displays on-chart, realtime, delta volume and delta ticks information for each bar. It aims to provide traders who trade price action on small timeframes with volume and tick information gathered as updates come in the chart's feed. It builds its own candles, which are optimized to display volume delta information. It only works in realtime.
█ WARNING
This script is intended for traders who can already profitably trade discretionary on small timeframes. The h
Indicator PanelHello All,
This script shows Indicator panel in a Table. Table.new() is a new feature and released today! Thanks a lot to Pine Team to add this new great feature! This new feature is a game changer!
The script shows indicator values for each symbol and changes background color of each cell by using current and last values of the indicators for each symbol. if current value is greater than last value then backgroung color is green, if lower than last value then red, if they are equals then
'Golden ratio' Cubes - 'GoRaC'The difference between 2 points is plotted here using 'Golden ratio' cubes
(working differently than my 'Golden ratio spiral - 'GoRaS')
The 2 points can be 'high/low' or 'max(open/close)/min(open/close)',
with the possibility of higher resolution, the following examples are with 1 week resolution
By extending the lines you can spot support/resistance area's
You can reverse:
or 'mirror':
The 'bars back' can be set to get a previous period
Important:
In the example of a week