Ichimoku on closing price without current bar @bhutanoThis is the "Ichimoku" rivisited.
The current bar is not considerated on the plotting (so less chance to confusion) and the averages are calculated on the closing prices. It seems to be more precise then the original one.
Leave me a comment please based on your experience
Nuage d'Ichimoku
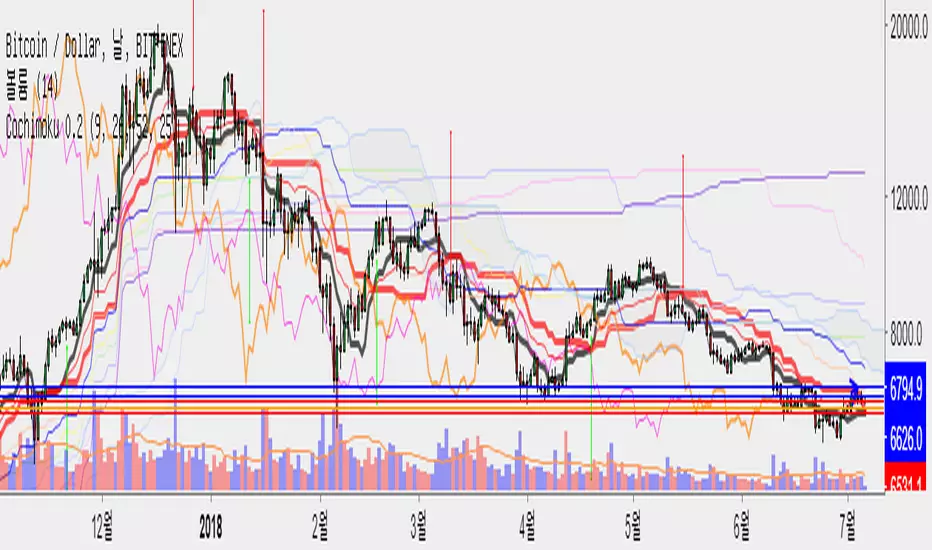
Covengers Ichimoku Cloud ver 0.2Ichimoku Cloud by SigmaJ in TEAM Coin Avenegers
ver 0.1 -> ver 0.2 Release !
Ver 0.2 updated.... like below...
+ Yumdung Momentum
Yumdung Momentum is based on Ichimoku Base Number Line
42 , 65 , 76, 129, 172 , 226
These Lines mean Resist / Support.
If There are many lines at one price, there could be STRONG Resist or Supprot Line.
-
코치모쿠 0.1 -> 0.2 버전 공개!
버전 0.2에는 다음과 같은 내용이 추가되었씁니다.
+ 윰멘텀 (윰둥이 모맨텀)
윰멘텀은 일목균형표에서 말하는 기본 수치에 대한 내용을 담고 있습니다.
기본 수치는 42, 65, 76, 129, 172, 226 입니다.
이 라인이 뭉쳐진 곳은 지지/저항의 역할을 할 가능성이 큽니다.
한 가격에 이 라인들이 뭉쳐있다면, 그곳은 강력한 지지 혹은 저항이 됩니다.

ICHIMOKU Kinko Hyo by KIVANC fr3762Created in 1940's by Goichi Hosoda withe the help of University students in Japan.
Ichimoku is one of the best trend following indicators that works nearly perfect in all markets and time frames.
Ichimoku is originally an built in indicator in Tradingview but there are some problems like:
the indicator hast 5 lines but you can change only 4 parameters in the settings menu of Tradingview Charts which you could only control 3 of the lines effectively. A second problem is that Tradingview preferred to use English titles for the ICHIMOKU lines instead of giving them the most common original Japanese ones. (So I rewrite the indicator)
Kijun Sen (blue line): Also called standard line or base line, this is calculated by averaging the highest high and the lowest low for the past 26 periods.
Tenkan Sen (red line): This is also known as the turning line and is derived by averaging the highest high and the lowest low for the past nine periods.
Chikou Span (Plum line): This is called the lagging line. It is today’s closing price plotted 26 periods behind.
Senkou SpanA (green line): The first Senkou line is calculated by averaging the Tenkan Sen and the Kijun Sen and plotted 26 periods ahead.
Senkou SpanB (purple line):
The second Senkou line is determined by averaging the highest high and the lowest low for the past 52 periods and plotted 26 periods ahead.
PERSONALLY I ADVISE YOU TO USE ICHIMOKU WITH DEAFULT LENGTHS (9,26,26,52,26) IN ORDER FOR STOCK MARKETS AND FOREX MARKETS
FOR CRYPTO YOU'D BETTER USE:
10,30,30,60,30 OR 20,60,60,120,60
THE TRICKY THING IS THAT KEEPING THE 1-3-3-6-3 RATIO CONSTANT IS NECESSARY
Here's a link of my Youtube video explaining ICHIMOKU but unfortunately only in TURKISH:
www.youtube.com
Developed by: Goichi Hosoda

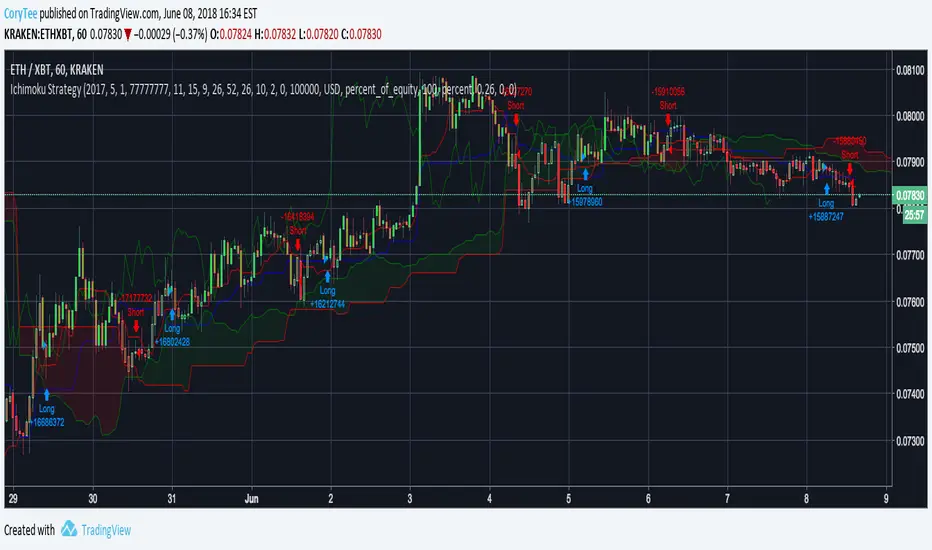
CoryT's Noro's Ichimoku AlertsA few months ago I took Noro's Ichimoku Cloud and used the AV bot template to throw stops on it. I took some code from JustUncleL
to make it not so hideous. Trailing Stops are turned off, stop losses are turned off (you really don't need them with this), and this is currently a Long/Short strategy, the Longs Only and Shorts Only options are broken right now, I'm tired and you guys can either fix it yourselves or deal with it like this for now.
Hint: If you wanna use this as a long-only strategy just have AV close your buy orders whenever a short is triggered.
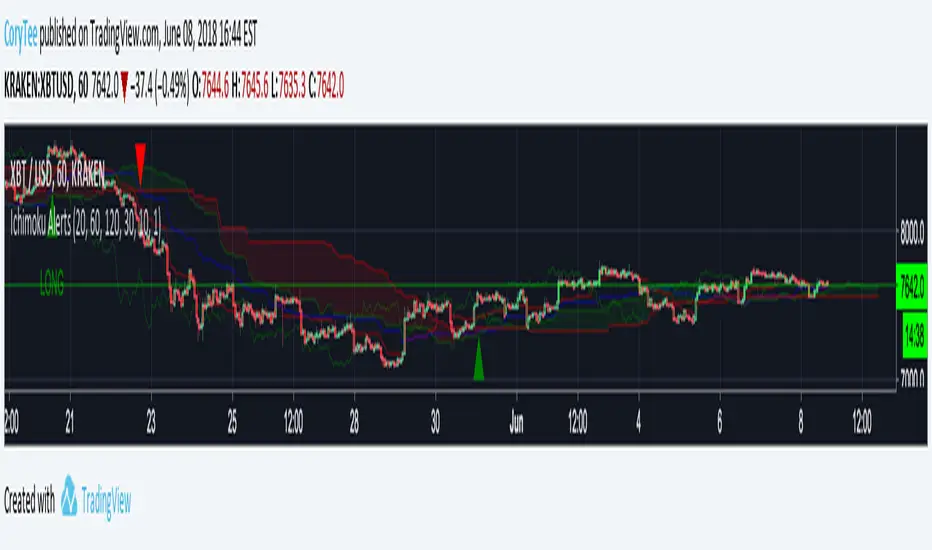
CoryT's Noro's IchimokuA few months ago I took Noro's Ichimoku Cloud and used the AV bot template to throw stops on it. I took some code from JustUncleL
to make it not so hideous. Trailing Stops are turned off, stop losses are turned off (you really don't need them with this), and this is currently a Long/Short strategy, the Longs Only and Shorts Only options are broken right now, I'm tired and you guys can either fix it yourselves or deal with it like this for now.
Hint: If you wanna use this as a long-only strategy just have AV close your buy orders whenever a short is triggered.
Covengers Ichimoku Cloud Easy 0.1
This is Covengers Ichimoku Cloud's EASY VERSION.
This is for you who don't know about Ichimoku,
to describe "Time tiktok & Price tiktok Trading".
☆Time tiktok & Price tiktok Trading☆
IF 1. DON'T CARE ABOUT LOWEST PRICE.
IF 2. DON'T CARD ABOUT HIGHER PRICE.
BUY IF 1. IS "CLOSE" BROKE THROUGH BASE LINE?
BUY IF 2. IS "CLOSE " SUPPORTED BY BASE LINE?
-> THEN BUY !
At this time, Base line should be STOP LOSS line.
SELL IF 1. IS "CLOSE" BROKE THROUGH BASE LINE?
SELL IF 2. IS "CLOSE" RESISTED BY BASE LINE?
SELL IF 3. IS "CLOSE" BROKE THROUGH ICHIMOKU CLOUD?
-> THEN SELL !
Buy conservatively, Sell aggressively.
"less LOSS" better than "much PROFIT"
-
Covengers Ichimoku Cloud의 EASY 버전입니다.
차트를 하나도 모르는 당신에게
임운자재를 설명하기 위해 만들었습니다.
☆임운자재 매매법☆
절대 조건 1. 바닥에는 관심을 두지 않는다.
절대 조건 2. 천장에는 관심을 두지 않는다.
매수 조건 1. 종가가 기준선을 돌파하였는가?
매수 조건 2. 종가가 기준선의 지지를 받는가?
-> 매수
이 때, 손절라인은 기준선이 된다.
매도 조건 1. 종가가 기준선을 돌파하였는가?
-> 매도
매도 조건 2. 종가가 기준선의 저항을 받는가?
-> 매도
매도 조건 3. 종가가 구름대를 돌파하였는가?
-> 매도
매수는 보수적으로, 매도는 공격적으로.
많이 따는 것보다, 잃지 않는 것이 중요하다.
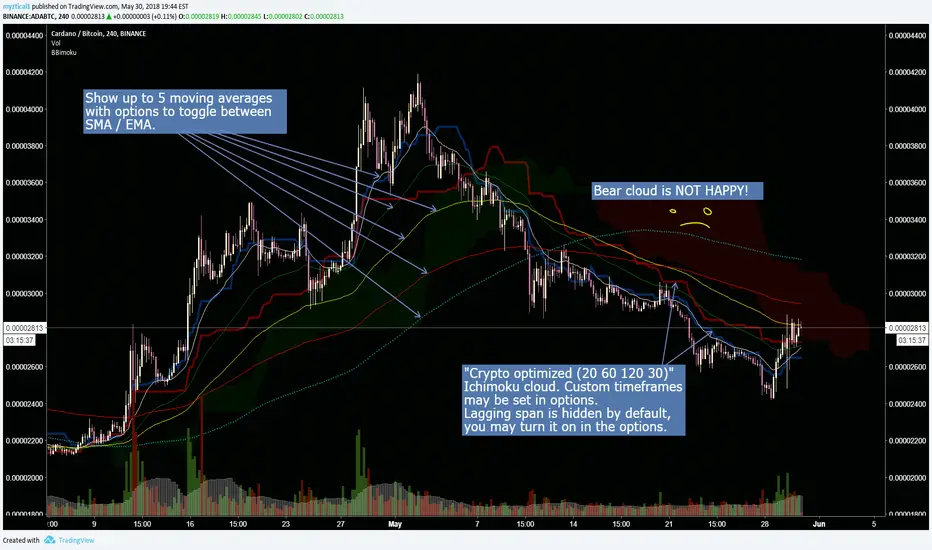
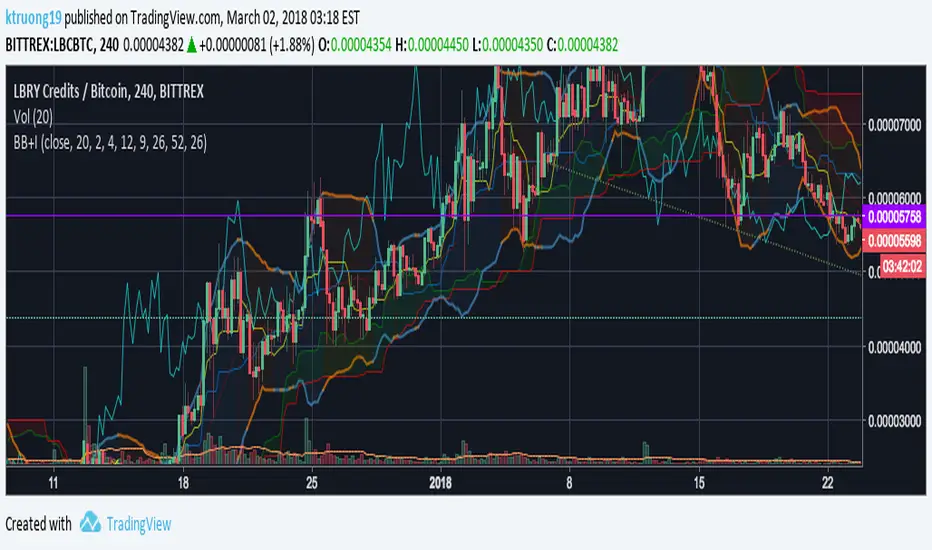
Crypto optimized Ichimoku and 5 variable SMA / EMAThis script has the option for showing up to 5 moving averages with options to toggle between SMA / EMA. Also includes crypto optimized Ichimoku cloud.
********This script was pieced together from various other's contributions from this site, and I cannot remember who the original authors are*******
Im just combining them to help others with free accounts and limited indicator availability like myself.
I hope this can help someone! Thank you and enjoy.


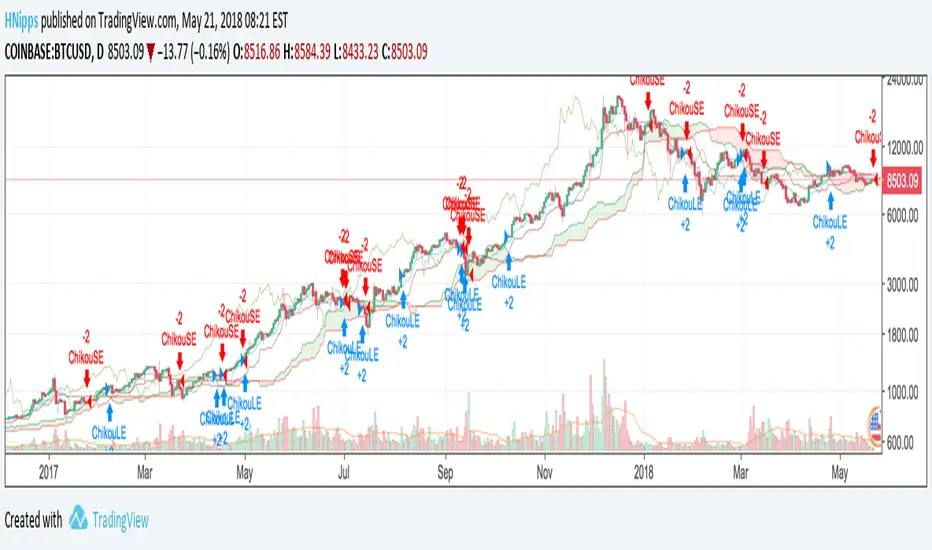
Chikou CrossoverA very simple Ichimoku Cloud strategy. Buy when Chikou Span crosses above price. Sell when Chikou Span crosses below price.


Ichimoku Cloud StrategyBased on the trading strategy described at
stockcharts.com
See Also:
- Backtesting and forwardtesting (of TradingView Strategies)
- 9 Mistakes Quants Make that Cause Backtests to Lie
- When Backtests Meet Reality
- Why MT4 backtesting does not work
Ichimoku Cloud strategy for gold marketThis strategy is based on main ichimoku features (Leading span , conversion line and base line) compared to cloud conditions.
I indicated all possibilities in this indicator and strategy decision is based on crossing factors of each main line through two other line confirmations.

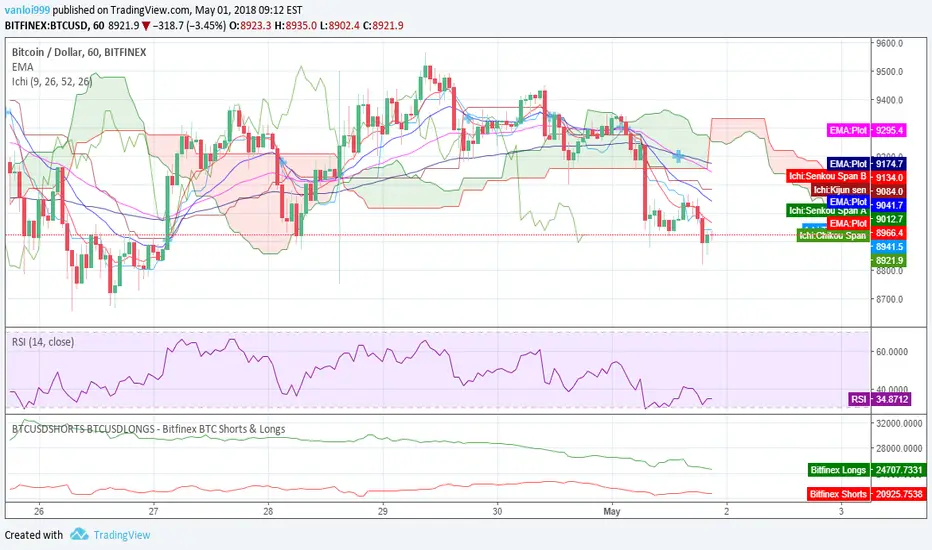
My BTC/USDT 45min Ichimoku Strat v2Improved last version by adding a RSI derivative condition, which is very effective for spotting sheep herd moves, and follow them asap.
TSP Ichimoku Clouds x2 MTFDouble Ichimoku
Use a Multiple of current time frame :
15m * 4 = 1h
1h*24 = 1d


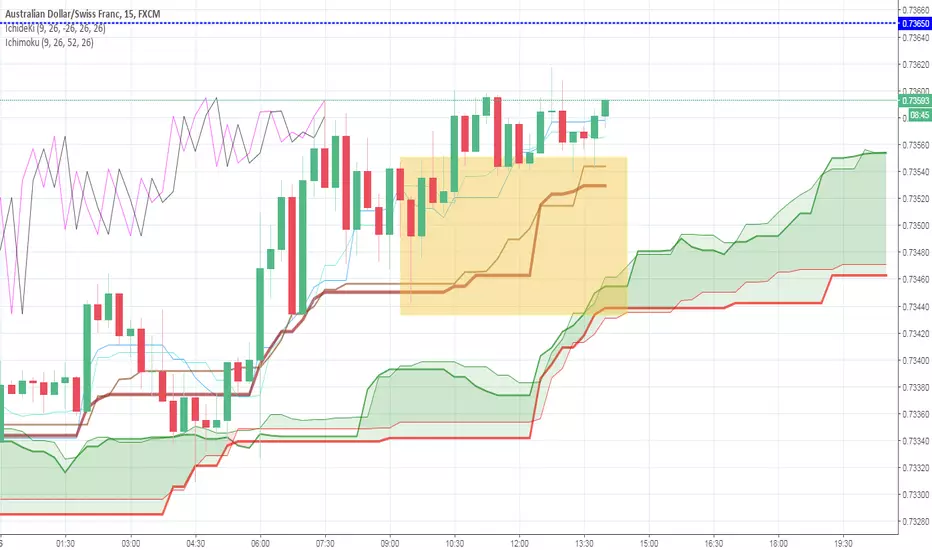
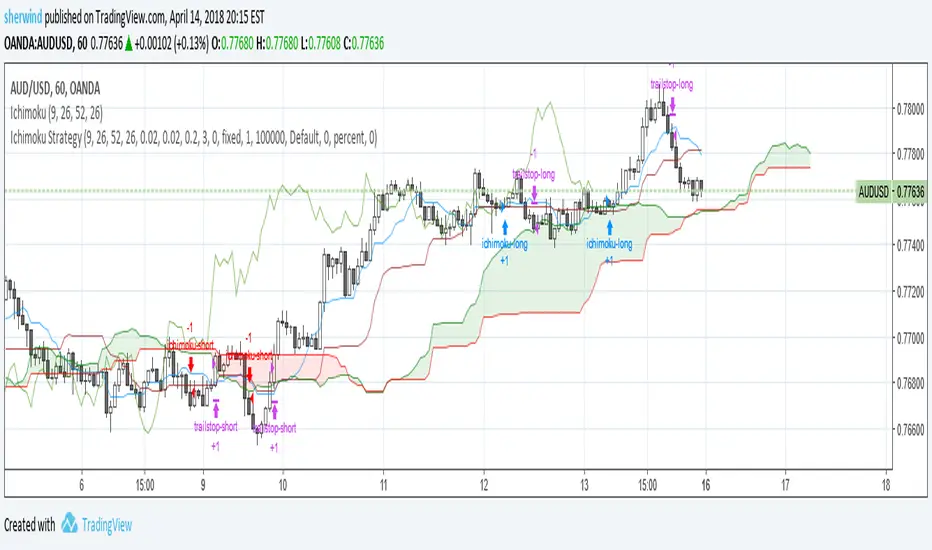
My Ichimoku indicator & Strategyhello I'm a beginner in trading, but I try to learn how to code strategies.
I recoded the Ichimoku indicator, and created my personnal strategy based on it.
The backtesting is done from 1/1/2017 to today in 45 min Time Unit for candles, with a 1 000 € equity.
The trades are all Long Entries and Exits with no pyramiding, no short trades at all.
/!\ Exchanges commission fees are not calculated and can in reality easily divide by 2 the total profit (am I right guys?) /!\
A buy signal is triggered upon these conditions:
- close is above the Kuma (cloud)
AND
- close crosses over Kijunsen AND Kijunsen is not flat (calculated with rising and falling with input "Kijunsen Lag")
OR
- Close crosses over ChikouSpan AND there was a sell signal in the last 8 candles
Sell signal is the same but reversed.
I appreciate your feedback ! Maybe I will update this later if I get better results.

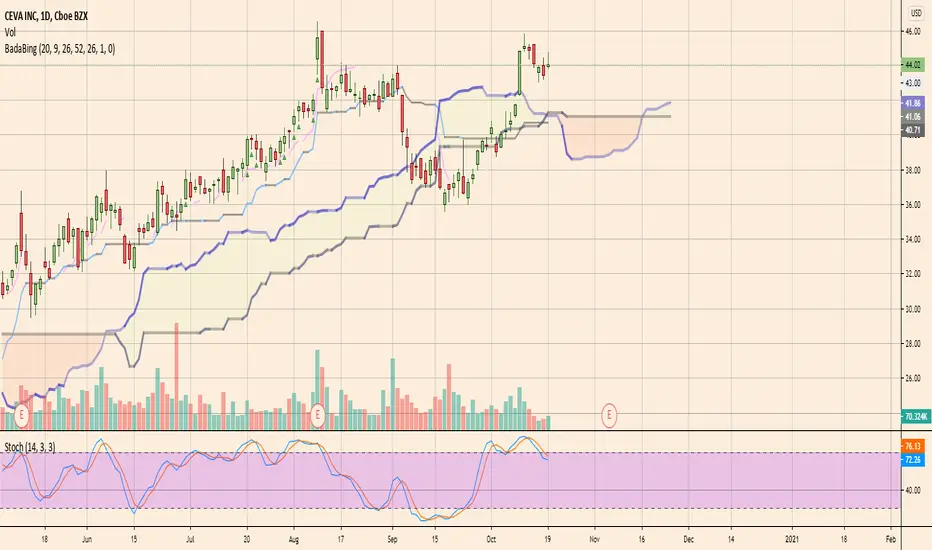
BadaBing Ichimokusignals with a "bada" when the conversionLine crosses the base line
signals with "bing" when:
1. cloud is bullish
2. future cloud is bullish
3. conversion line is above base line
4. base line is above cloud
5. price crosses above conversion line
(the short "bing" is when all the above conditions are false)
this just kind of codifies one of the simplest and safest ichimoku signals
profit taking is not detailed here...
a bada followed shortly by a bing is the best signal
improvements for later:
- I think I maxed out the number of plot calls. maybe need to split ichimoku plot itself from the signals
- add volatility filter using cloud width
- add overextension check by checking distance from conversion line (historically ive used an ATR buffer for this)