Institutional Moves DetectorIndicator Name: Institutional Pattern Detector
What It Does:
Trend Following: It uses a Moving Average (MA) to understand the general direction of the price. The MA is like a smoothed-out line of the price over time, showing if the price trend is going up or down.
Volatility Measurement: The script employs Bollinger Bands (BB) to see how much the price is fluctuating. Bollinger Bands create an upper and lower "channel" around the price, which gets wider or narrower based on how volatile the price is.
Volume Check: It looks at trading volume to find times when there's unusually high activity, which could mean big players (institutions like banks or funds) are trading. It flags this when the volume is 1.5 times more than the average volume of the last 100 bars.
Pattern Detection for Trading Signals:
Entry Signal ("IN"): When there's high volume and the price is above the upper Bollinger Band, it suggests there might be strong buying from big institutions. This could mean the price might keep going up.
EXIT Signal ("OUT"): If there's high volume and the price falls below the lower Bollinger Band, it indicates possible strong selling pressure from institutions, suggesting the price might go down.
Visual Cues:
An orange label "IN" appears below the price bar for entry signals.
A red label "OUT" appears above the price bar for exit signals.
The moving average line is plotted on the chart in orange to help you see the trend.
Alerts: The script can alert you when these entry or exit signals occur, so you can get notifications without needing to stare at the chart all day.
For New Traders:
This indicator helps you spot when big traders might be influencing the market, potentially giving you a clue about when to enter or exit.
Remember, this is one tool among many. You should not base your trading solely on this; combine it with other analysis methods.
It's always wise to practice with a demo account before using real money to get a feel for how these signals work in actual market conditions.
Institutional_trading

Institutional Activity Index [AlgoAlpha]🌟 Introducing the Institutional Activity Index by AlgoAlpha 🌟
Welcome to a powerful new indicator designed to gauge institutional trading activity! This cutting-edge tool combines volume analysis with price movement to derive a unique index that shines a spotlight on potential institutional moves in the market. 🎯📈
Key Features:
🔍 Normalization Period : Adjust the look-back period for normalization to tailor the sensitivity to your trading strategy.
📊 Moving Average Types : Choose from SMA, HMA, EMA, RMA, WMA, or VWMA to smooth the index and pinpoint trends.
🌈 Color-Coded Trends : Instant visual feedback on index trend direction with customizable up and down colors.
🔔 Alerts : Set alerts for when the index shows increasing activity, decreasing activity, or has reached a peak.
Quick Guide to Using the Institutional Activity Index:
1. 📝 Add the Indicator: Add the indicator to favorites. Adjust the normalization period, MA type, and peak detection settings to match your trading style.
2. 📈 Market Analysis: Similar to volume that reflects the amount of collective trading activity, this index reflects an estimate of the amount of trading activity by institutions. A higher value means that institutions are trading the asset more, this can mean selling or buying as the indicator does not indicate direction . Look out for peak signals, which may indicate that institutions have already secured positions in preparation for a move in price.
3. 🔔 Set Alerts: Enable alerts to notify you when there is a significant change in the activity levels or a new peak is detected, allowing for timely decisions without constant monitoring.
How It Works: 🛠
It is common knowledge that institutions trade with high amounts of capital, but employ tactics so as to not move the price significantly when entering on positions. This can be done by entering in times of high liquidity so that when an institution buys, there are enough sellers to cancel out the price movements and prevent a huge pump in price and vice versa. The Institutional Activity Index calculates liquidity by measuring the volume relative to the price range (close-open). This value is smoothed using median and a user defined moving average type and period, enhancing its clarity. If normalization is enabled, the index is adjusted relative to its range over a user-defined period, making the data comparable across different conditions.
Embrace this innovative tool to enhance your trading insights and strategies! 🚀✨

Smart Money Interest Index [AlgoAlpha]🌟 Smart Money Interest Index by AlgoAlpha 🌟
Welcome to the innovative Smart Money Interest Index indicator, designed meticulously by AlgoAlpha to revolutionize the way you trade! 📈🧠 This indicator is engineered to decipher the activities of smart money investors relative to the less informed (dumb money) and dynamically display their dominance in the trading landscape through a sophisticated visual index. 🚀💹
🔑 Key Features:
- Smart vs. Dumb Money Analysis: Tracks and compares the movements of smart money (informed investors) and dumb money (general public) within the market to identify potential investment signals.
- Relative Strength Index (RSI) Based Ratios: Utilizes RSI for both smart and dumb money to create a ratio that indicates buying or selling pressures.
- Dynamic Normalization: Employs a long-term peak normalization over a customizable period to ensure the index remains relevant regardless of market conditions.
- Visual Thresholds and Signals: Highlights significant shifts in market dynamics with color-coded thresholds, making it easier to spot changes at a glance.
🛠 How to Use the Smart Money Interest Index:
🔹 🚀 Step 1: Adding the Indicator
- Add the indicator to your favourites.
- Customize the settings according to your analysis needs:
- `Index Period`, `Volume Flow Period`, `Normalization Period`, `High Interest Threshold`
🔹 📊 Step 2: Interpretation of the Index
- Monitor the index plot; a rising index suggests increasing smart money interest, potentially indicating a buying opportunity.
- A value above the high interest threshold (in yellow) highlights significant interest by smart money, suggesting a good time to buy.
🔹 🔔 Step 3: Setting Alerts
- Configure alerts to notify you when the index crosses above the set threshold, enabling you to capitalize on trading opportunities timely and efficiently.
📐 Basic Logic Overview:
The Smart Money Interest Index by AlgoAlpha provides a unique metric that contrasts the investment behaviors of informed (smart money) and general (dumb money) investors. Utilizing the Relative Strength Index (RSI), this indicator evaluates the trading pressure exerted by both groups over specified periods, then forms a ratio of these activities to identify dominance in buying or selling trends. For example, when we see dumb money selling and smart buying, this suggests that the conditions for buying the asset is optimal as smart money is willing to buy the dip. The outputs are normalized against the highest values observed in a user-defined term to maintain consistency through varying market conditions. When the index exceeds a certain threshold, it suggests that smart money presence is particularly strong, possibly indicating that smart money is looking to enter positions on the asset. This tool serves as a sophisticated visual guide to understanding market dynamics and making well-informed trading decisions based on the activities of market-savvy investors. Smart money activity is identified during areas of low volume and the opposite for dumb money, the indicator uses the NVI and PVI metrics as its foundation for smart and dumb money analysis.
📊 Enhance Your Trading Strategy:
Leverage the Smart Money Interest Index to gain deeper insights into market dynamics and enhance your decision-making process with a powerful, data-driven approach. Whether you're looking to identify entry points or set strategic exits, this tool is designed to provide you with the competitive edge you need in the fast-paced world of trading. 🌐✨
Transform your trading with the power of smart money analysis—start using the Smart Money Interest Index today! 🚀🔔

ASE Supply & Demand█ Introduction
ASE Supply & Demand is a multi-timeframe Supply and Demand zone indicator based on the Order Block concept. Order Blocks are a price action concept defined as a basing candle followed by a breakout candle (as seen in the chart below). A basing candle typically shows a slowing down in price action, foreshadowing a reversal and initial institutional activity. The breakout candle then confirms institutional activity with a displacement candle in the opposite direction of the basing candle. Additionally, there is an advanced feature called “Potentials,” which allows us to see price action forming S&D zones beforehand & trapped positions live through the same Order Block concept.
█ Supply and Demand Zones
The Supply & Demand zones are plotted on 8 timeframes (5m, 15m, 30m, 1hr, 2hr, 3hr, 4hr, D). In addition, there are custom settings that allow the trader to filter for the most significant zones and to cohere to their trading style:
Range Multiplier
Filters the creation of a zone based on the basing candle of Supply/Demand(0-5)
The size of the basing candle must be smaller than 0-5 times the True Range Index to create Supply/Demand.
If the basing candle range is smaller than the True Range Index, this can foreshadow the potential of institutional activity as price slows down, and a potential reversal might occur.
True Range Index
The number of bars to calculate the True Range in Range S+D mode.
Displacement Sensitivity
Filters the creation of a zone based on the displacement from the base (0-20)
Calculated by taking the breakout range (as seen in the chart below) divided by the range of the basing candle
0 = less significant, more zones
20 = more significant, fewer zones
Zone Strength Filter %
Filter out current zones based on how strong they are (0-100)
Calculated by the amount of fill within a zone. By changing the Zone Strength Filter, you can display zones that have not breached the filter % you select. For example, if you choose 80% Zone Strength, that means it will only show zones that are 20% filled or less; in other words, zones that have 80% or more yet to be filled.
0 = All Zones
100 = Completely unused zones
With these advanced filters and plotting on multiple timeframes, we have created the best Supply and Demand Indicator . In addition, these filters help to eliminate insignificant zones and noise in the market, leaving us a clean chart.
█ Potentials
Potentials foreshadow the possibility of a Supply or Demand Zone forming, the possibility of a Trapped concept, and it works great as targets or influence in our trades.
Potentials are calculated by the same Order Block concept, which allows us to see Supply & Demand/Order Blocks forming in real-time.
When a potential is triggered and holds, the line turns solid. If it continues to hold, it has the potential of forming a Supply/Demand zone based on the trader's Zone Filters. If the price pulls back and fails to hold, it will go back to dotted. Inferring it used the potential as liquidity and is potentially trapping market participants at that potential.
█ How To Use:
Supply and Demand Zones are the ‘Where’ to our trade but not the ‘Why.’ This means that the zones are our POI (Point of Interest) and ‘Where’ we want to be looking for a trade. It is not our ‘Why’ because we do not enter just because we are in a zone. This is because we expect pivots or reversals inside our Supply & Demand zones, and this rarely happens quickly.
What we want to look for in our zones is a solid base for our reversals. Simply put, we want to see new demand forming at our Demand Zones and new supply forming at our Supply Zones. This can be achieved by observing the ‘Potentials’ feature which allows us to see new Order Blocks or ‘Base Candles’ forming. With a trained eye, the ‘Potentials’ feature is highly effective in addition to its ‘Trapped’ logic which can offer entries on their own. The "Trapped" label on potentials shows potential trapped buyers or sellers after we reach that level. Observing and understanding how price action facilitates, especially around the zones, is crucial to its usability. In addition, other strategies or indicators can be used in confluence to support bounces out of demand and rejections out of supply.
Ultimately once we find a viable entry, we want to see a complete cycle. For example, if we caught a bounce out of demand with new demand forming, we would want to see the cycle complete and us reach the next supply or manufacture new supply. The ‘Potentials’ feature is the easiest way to gather multiple targets and at the same time offers stop loss management.
█ Settings:
Enable Supply/Demand/ Zones and Potential Liquidity
STF S&D Zones - Enables 5 minute and 15 minute timeframe for zones
LTF S&D Zones - Enables 30 minute and 1 hour timeframe for zones
HTF S&D Zones - Enables 2 hour, 3 hour, and 4 hour timeframe for zones
Daily S&D Zones - Enables Daily timeframe for zones
Enable Potentials
Supply Demand Zone Models
Range - Filters zones based on the range of candles before supply/demand
Displacement - Filters zones based on the displacement of the breakout candle
Range + Displacement - Filters zones based on the displacement of breakout candle and range of the candles before supply/demand
Supply Demand Zone Filters (see “Supply and Demand Zones” section for usage)
Range Multiplier
True Range Index
Displacement Sensitivity
Zone Strength Filter %
Deletion Conditions
Confirmed - Deletes zone upon time-frame close above supply or below demand
On Break - Deletes zone upon break above the top of supply or break below bottom of demand
On Tap - Deletes zone upon the touch of supply or demand
Other Settings
Price Labels - Turns on Zone Price Levels
Supply/Demand Color Input - Customize color of zones to your liking
Supply Demand Border Width - Change the border width of zones (0 would be completely borderless zones)
Supply Demand Transparency - Change transparency of zones (0 is completely solid zones, 100 is completely transparent)
Transparency Input - "Normal" Transparency stays at the level that's set; "Decrease with price" as price moves through, the zones become more transparent
Default Color - Changes color of any text/labels (default is gray)
Text size - Change size of text on labels

Professional Zones - Institutional Demand and Supply Imbalances
Intro to Supply and Demand Zone Technical Analysis
Supply and demand is an increasingly common strategy among day and swing traders in equity, forex, and the futures markets. The goal of analyzing supply and demand zones is to pre-determine where price action may pivot before that pivot happens, thus giving us an edge over the market. There are many unique charting/trading strategies that fit under the supply and demand umbrella, however we are going to focus primarily on Institutional Zones of Demand and Supply Imbalances, as this is what our TradingView indicator actively displays.
What are Institutional Zones of Demand and Supply Imbalances?
First, let’s break down the phrase above. The first word is ‘institutional’, which is a key aspect in our trading. As a retail trader, you must understand that retail traders (individual traders like you and I) have very little control and very little effect on price action in the major markets. The price action that we see everyday is caused by large institutions and hedge funds buying and selling equities in massive quantities.
This chart displays the price action for ES, which is the S&P500 E-mini futures .
At the time this guide was created, that chart for ES displays the low of this year (2022). You can see major highs and major lows, as well as steep drops and momentous runs.
Price action like this appears random to the naked eye, however it is all controlled by major institutions. These institutions place large buy and sell orders for markets such as the S&P 500 Index which causes these moves.
Our Institutional Demand and Supply Analysis attempts to discover the price zones where institutions have placed their buy/sell orders. Their buy orders create “demand zones”. And their sell orders create “supply zones”. Knowing where these zones exist allows us to anticipate price trend reversals so we can profitably participate in them alongside the major institutions when these key moves take place.
We are looking for areas in the chart where institutions have created major imbalances (more buy orders than sell orders or vice versa) which creates demand and supply zones that impact price action and trend reversals in predictable ways.
What Causes These Supply and Demand Zones?
Understanding that institutions control the price of the markets is crucial for understanding how these zones of supply and demand imbalances are formed, and it can be derived from historical price action.
There are two types of price action, balanced and imbalanced. Balanced price action is flat, consolidatory price action where the overall direction is sideways. Imbalanced price action is an exaggerated move in price either up or down. Now here is the key: institutional supply and demand imbalances are formed when price action goes from balanced to imbalanced. Below is an example of balanced price action .
There are clearly areas of institutional buy and sell orders that are causing price action to oscillate between the areas of demand and supply. The longer price action consolidates and moves sideways, the larger the volume profile will be in this range. In other words, more institutional orders will build up as price remains relatively the same for a longer period of time.
Here is how a demand zone is formed :
Due to bullish CPI news, price action went from balanced to imbalanced by exploding to the upside. This bullish price action filled all of the sell orders and broke past the previous area of supply. Because price moved up so fast, the buy orders did not get a chance to fill, essentially leaving an area with a high concentration of buy orders remaining. Hence, a new demand zone is formed which is shown here .
Our state-of-the-art indicator automatically scans for these historical shifts in price action (balanced to imbalanced) via our supply and demand zone detection formula, and displays them on your chart instantly. Remember the first image sent of blank price action? Here it is below:
The image below shows the exact same chart of ES, however, our advanced Professional Zones - Institutional Demand and Supply Imbalances indicator has been applied to the chart.
Just like that, price action has been transformed from unexplainable chaos to an orderly sequence of demand bounces and supply rejections.
Yes, all of these zones may be charted manually if one were to acquire the knowledge required to chart them by hand, and spend numerous hours going back in time to find all these zones. Additionally, these charts would then have to be constantly monitored and updated, which would require hours of work each day. This powerful indicator automates all of that work to give you more precious time to analyze and trade these zone-driven pivots in the markets.
How To Measure the Strength of Supply and Demand Zones?
The longer the consolidation takes place, the larger the demand/ supply zone will be. This strength is measured by the time frame of the origin of the zone.
Each zone may be formed on a different time frame, the biggest being the 1 Month time frame, and the smallest being the 30 Minute. Each supply and demand zone is automatically labeled based on the time frame from which the zone originated.
The weakest zones are derived from the 30 minute time frame. This means the zone only took two 30 minute candles to form, which is not a lot of time for institutions to place large orders. This means that the bounces and rejections off of these zones will usually be smaller, and usually won’t last more than a few days.
Larger zones such as 1 Day, 1 Week, and 1 Month often cause large swings in the market lasting weeks, months and even years. So pay attention not just to where the demand and supply zones currently appear, but also to the strength of that zone. You can see below that the demand zone that the market bottomed in and reversed out of in 2022 was in fact, a very strong weekly zone.
What is the Significance of Supply and Demand Zone Breaks?
These zones are order-based. This means that a supply zone level doesn’t turn into demand when price action breaks above it, and demand doesn’t turn into supply when price action breaks below it. It is unlike standard trend-based support and resistance levels. If price action breaks below demand by even $0. 01 , all of the buy orders have been filled and the demand must be deleted from the chart (and vice versa for a supply zone ).
While it is possible to play these zone breaks as continuation plays off of current momentous price action, it is unpredictable how far price will go up or down after breaking supply or demand during that leg.
However, in my years of supply and demand experience, I have noticed that if demand breaks, the market will eventually come down to the next viable demand zone . This is because without a pivot caused by an institutional-created demand or supply imbalance, there is often not enough participation to cause a sustainable trend reversal for a long period of time. Below is an example of this:
Above is the 4 Hour chart of TSLA bouncing up off of a demand zone . We call this a bounce in “no man's land”, as there is no major demand bounce to support this reversal to the upside. So in theory, price action should return lower to the next major historical zone of demand before it has a chance of pulling off a solid reversal. Here is what happened:
As you can see above, TSLA did indeed end up heading back down into the next major demand zone before getting a sustainable reversal to the upside. So you may play these supply and demand zone breaks as continuation trades, either long or short, with a price target at the next major zone. Just make sure to use proper risk management and position sizing, as timing the trigger of a price target can be difficult.
How Might I Place a Trade Using the Indicator?
Now that the basics of institutional supply and demand zones have been discussed, there will come a time that this strategy must be actively applied to personal trading with a goal of becoming profitable. Here is a step-by-step process to place a trade using supply and demand paired with an example of a day trade from the 1 minute time frame.
Step 1: Find a highly institutionally traded stock that is currently in supply or demand as shown by our indicator. For example, AAPL:
Step 2: Look for an above-average (exaggerated) volume spike. Because we are in one of the green zones at the bottom of the chart, we know that we are in demand where large institutional buy orders reside. We need to wait for some of these orders to actually fill before we take our trade. This is known as volume confirmation. The color of the volume usually does not matter in this situation.
Step 3: Now that we have a volume spike which is confirmation of large orders being filled, we need more confirmation that the institutional orders are not only a buy, but large enough to actually reverse the current trend.
This is ultimately a judgment call. A few green candles may be good enough to dictate a reversal, or a trend break. It comes down to personal preference and how aggressive you would like to be. Keep in mind, the longer you wait, the more confirmation your trade has, but also, the longer you wait, the greater the risk of missing the new trend. In this example, we will use a trend line to confirm our trend reversal.
Step 4: Enter the trade. Now that you have proper demand confirmation, you may place your trade. Be sure to determine your stop loss, price target, position size, and all other risk management factors along the way.
In this example, AAPL ran all the way up to supply before rejecting; making for a perfect demand to supply call trade. Also, more short trade entries could have been taken based off of the multiple supply rejections AAPL had.
The Bottom Line
There are many ways one may go about trading the stock market. However in my years of trading and teaching, there has never been a strategy that has not only changed my career, but improved the trading careers of my students, more dramatically than Institutional Zones of Demand and Supply Imbalances.
Though charting new zones and deleting broken ones everyday was time consuming and repetitive, the results of trading these zones made it well-worth the hours of charting. However, after months of development and fine-tuning, the painful charting process has been automated by this powerful indicator, completely replacing the tedious charting work for myself and my students.
While numerous other indicators include the name “Supply and Demand Zones”, we believe that no supply and demand indicator remotely this advanced and accurate available on TradingView. I am very blessed to finally bring this revolutionary tool to the market.
Introduction to the Aurora Demand and Supply Indicator for TradingView and its Functionality
This page is dedicated to providing a thorough walk-through of our Professional Zones - Institutional Demand and Supply Imbalances indicator. The settings functionality, customizability, and purpose will be discussed to give you an in-depth understanding of the indicator. Understanding the purpose of the different functions and settings is crucial to utilizing this powerful tool at its full potential.
First Look Upon Indicator Addition
After purchasing the indicator, your chart may initially appear cluttered, zoomed out, and hard to read. But do not worry, it just means the indicator settings must be fine-tuned to optimize your experience. Tt may appear overwhelming. However this page will discuss each major customizable setting and the functionality behind it to streamline your TradingView set up.
Filter Options Settings Category
This is the first customizable feature that appears when accessing the settings of the indicator. What Filter Zone Ranges does is allow you to filter the range at which zones appear both above and below the current asset price. With this setting unchecked, every single demand and supply zone within the 5k candle limit (or 20k limit if you have a premium TradingView account) will appear on your chart. This causes chart clutter which limits the visibility of price action.
If you have this setting activated, you can choose exactly the range of zones visible to you. This range is percent based and is measured both above and below the current market price. For example, if you activate Filter Zone Ranges and set the Filter Percentage at 7%, only zones within the range of 7% above, and 7% below the current asset price will be shown.
Demand/ Supply Zone Options Settings Category
The next two categories contain the majority of the customizability for supply and demand zones. The first option in both the Demand/ Supply Zone Options is Create Demand/Supply Zones. This toggle is very straight forward, you may choose whether or not to display all demand zones, or all supply zones.
The next two options are Demand/ Supply Zone Border and Demand/ Supply Zone Fill. Again, these are straight forward. The border setting allows you to edit both the color and opacity of the zones’ border lines. The fill setting allows you to edit the color and opacity of the interior of the supply/demand boxes.
Following the first pair of visual settings, you will see Demand/ Supply Zone Box Offset. This allows you to toggle how much the indicator offsets each zone from its origin point. In other words, move it to the left or right from the point in time at which the zone was created. The 0 offset is the base setting which is actually a slight offset to the right of the origin point to ensure that the candlesticks remain unobstructed visually.
After the offset options, you will find Demand/ Supply Zone ERC Multiple. This is a key setting which inputs the value our formula utilizes to scan the areas of institutional supply and demand imbalances. Unless you are extremely experienced with supply and demand analysis or you are running backtesting, it is highly recommended this value is left at ‘2’ for both the demand and supply options.
The next two options you will see in your indicator settings are Extend Demand/ Supply Zone and Demand/ Supply Zone Size. This feature allows you to customize exactly how far your zones will extend from the point of origin into the future.
The three options on the drop down menu are Extend, Fixed, and Dynamic. Each of these options extend your zones in a different fashion. It is important to note that the value inputted in the size option is the amount of units the zones will extend to the right for both Fixed and Dynamic options. The larger this input is, the further out the zones will extend into the future, and vice versa.
The final setting in the Demand/ Supply Zone Options category is Broken Zones to Keep and Broken Demand/ Supply Zone Fill. The Broken Zones to Keep input allows you to see recent supply or demand zones that have been broken and deleted from your chart. This may be useful for a trader in a few different ways. The Broken Demand/ Supply Zone Fill setting allows you to customize the number of broken zones displayed as well as their color and opacity. The most prominent example of this option’s utility is for traders that do not observe price action during the entirety of the market open.
If an individual left their charts for a few hours and missed a demand break, it may give the illusion that there was never a demand there and price action has been in “no-man's land” all day. However if that individual inputted ‘1’ in the Broken Zones to Keep setting, they would be able to see that a demand has broken. This may be useful as the trader may have an altered sentiment after knowing that a zone did in fact break.
Note: the value inputted is the amount of previously broken zones that will appear on your chart. For example, if the value ‘3’ is inputted, the three most recently broken zones will appear on your chart.
Time Frame Options Settings Category
Time Frame Options Settings allows you to toggle which supply and demand zones appear on your chart by time frame. For example, if you are analyzing a chart on a larger time frame such as the daily or weekly, the small 30 minute and 45 minute zones will often clutter your chart. By deselecting the weaker and smaller time frame zones, it will clean your chart up, allowing you to only see the zones that assist your analysis.
However the first two options in the category are unique.The first is Show Forming Zones. This option is extremely useful if you are watching price action play out live, when seeing the possibility of a supply or demand zone forming may be of benefit during your day trading. By toggling this setting ON, you will see all possible supply and demand zones forming in real time. However, this could cause clutter if multiple zones are forming at once in which case, toggling it off may be more beneficial.
The second option in the Timeframe Options category is the Show Zones Inside toggle, which controls the table at the top right of your screen (you may get rid of this table by deselecting tables in display settings).
This setting simply is a “yes” or “no” as to whether or not the table located at the top right of your screen will display the number of zones price action is currently sitting in. This setting is useful as zones may sometimes pile up on top of one another, making it hard to know exactly how many zones price action is currently sitting in.
Gap Options Settings Category
Just below the Timeframe Options category, is the Gap Options category. Gaps appear when two daily candles highs and lows do not overlap. These are often created when a catalyst is released into the market overnight causing a large move, resulting in a “gap” up or down the next morning.
A Gap often forms due to a strong move to the upside, and the indicator highlights this gap with a gray box. Gaps are important to many traders as there is often a large lack of liquidity inside the gap area, which often acts as a magnet that attracts future price action to fill it. If toggled on, the indicator displays the gap among the supply and demand zones seamlessly. The rest of the settings for this category are options to customize the color, opacity, size, and offset. These have the same effect as the options in the Demand/ Supply Zone Options category.
Text Options Settings Category
The final category in the indicator input settings is Text Options. This category allows you to toggle zone labeling on or off, and to specify how you would like the zone labels to appear. It’s strongly recommended that zone labeling is left ON because knowing the time frame a supply or demand zone originated from is a massive indicator of its strength. Top right alignment causes labeling such as “3H” to appear at the top right of each zone.
Indicator Data Limitations
There are a few limitations of TradingView which impact the Professional Zones - Institutional Supply and Demand Imbalances indicator. The first is the data TradingView provides to its users. With a basic TradingView account, a user only has access to 5,000 candles of data. So if a user is on the 1 minute time frame, that user can only see 5,000 candles before that current point. This is important because our advanced indicator scans historical price action that has formed supply and demand zones and displays it on your chart. This means that if a user is on a 1 minute time frame chart, they will only be able to see zones formed within the last 5,000 candles. Older supply and demand zones can not be displayed. However if a user has the Premium TradingView subscription, they can access up to 20,000 candles, which greatly increases the potential zones the user may see on the smaller time frames.
To counter this, we strongly recommend checking the larger time frames before starting your trading day, as there could be an old zone lurking behind the scenes. Once you spot it on the 30 minute time frame, for example, you may easily take note of the demand zone and its location.
The Bottom Line
This indicator has been intricately and powerfully designed to not only display institutional supply and demand imbalances more accurately and efficiently than any other TradingView indicator, but it has also been designed to give the user full control. Full control means the user has the ability to customize the appearance and inputs, as well as toggle specific objects visible to the trader.
We have meticulously designed the Professional Zones - Institutional Supply and Demand Imbalances indicator to be extremely valuable as a stand-alone strategy, as well as versatile enough to incorporate multiple other trading strategies on top of supply and demand .
However, in order for this indicator to be utilized by you at its full potential, it is important that you understand all of its features, capabilities and configuration options before you dive into trading.

SFC Smart Money Manipulation - MTF ZonesThis indicator shows the most important manipulated zones - true support and resistance.
The indicator can show the zones from different time frames - 1H, 4H, D and the current TF.
Order Block definition - small candle or few consecutive candles, where banks place buy and sell orders in order to manipulate the price. After price is manipulated and moved in one direction, the banks are in draw down, that is why they manipulate the price one more time before the true move, retesting these candles (closing losing positions).
FU candles
FU candles are most manipulated candles and create very strong reaction zones. These are the true zones, where the banks place their orders.
Why they are so strong? The answer is very simple - these candles clear the liquidity from the previous ones. After the liquidity is cleared ( all stop losses/pending orders are triggered), price reveal the true direction and move very fast.
FU candles are type of Order Blocks - the most powerful one.
Because the most volume is in the body of the order block. The indicator shows not only the FU candle, but the body of the order block.
There are two types of FU candles :
(only full FU candles are displayed as zones, because they are much significant)
1) Full fu, where the current candle completely engulf the previous one, after taking the liquidity. (displayed as F)
2) Current candle only take liquidity from the previous one, but failed to engulf it. (displayed as A)
9 day simple moving average is also displayed. When the price form Fu candle above/under the MA, there is a better chance for reversal.
When FU candles are retested the transparency will change, showing that the zones may have less impact.
Order Blocks
Only the current order blocks are displayed. Price react very often from the 50% level, that is why this level is also displayed.
Rejections
Rejections are doji candles or candles with big wicks. These rejections very often lead to reversals or deep pullbacks. But before the true move, price test the rejection levels. The retest is not always, but very often of the 50% of the wick.
The rejections are very important price zone.
The indicator can show the zones from different time frames - 1H, 4H, D and the current TF. When wicks are retested the transparency and colour will change, showing that the wicks may have less impact or no more impact.
Settings
-The colour and transparency of the zones can be changed.
- Multi time frames zones could be disabled.
- Doji settings
- Length of the moving average
How to use
If price reach one of the displayed zones. The trader should be prepared for price reaction. This reaction could lead to reversal, pull back or trading range.
The trader should have bias from the higher time frames and watch for signs of manipulations on smaller time frames.

Retail & Banker Net PositionsIn any market there are two major sets of participants, Retail traders (like you & I) who command relatively small amounts of capital and typically enter and exits positions quickly, and then Institutional Traders (sometimes referred to as whales) who command large amounts of capital and dictate the overall trend of the market but enter and exit positions slowly.
In this indicator we look at the distinct volume of these two sets of traders and use the net positions of this volume to determine if they are net long (Buying) in the market or net short (Selling).
When each set of traders are on opposite sides of the market (Retail are selling & Institutions are buying for example) it usually results in a battle and choppy price action... the majority of these battles are won by the Institutions as their large sums of money dictate the overall direction markets move.
Some of the best opportunities are when both sets of traders are on the same side of the market & this is where we see real momentum enter the market with quick price moves.
Happy trading =)

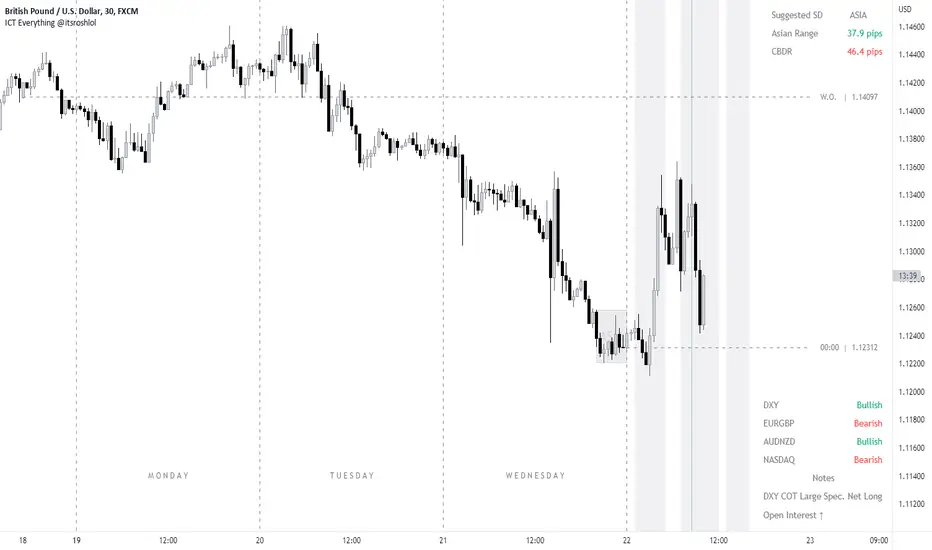
ICT EverythingVersion 1.0
Global Settings
• Timezone Selection
• Hide Indicator Above Specified Time
Thematic Override
• Override Colors For Dark Theme ( Colors Set for White Theme by Default )
• Override Session Highlighting Color
Session Options
• Show Historical Sessions
• Enable/Disable Session Highlighting
• Session Specific Visibility
• Session's Crucial Time Vertical Lines w/ Options
NY Midnight Line Options
• Show Historical NY Midnight Vertical Lines
• Midnight Verticle Line Options
• Show Historical NY Midnight Price Lines
• Midnight Price Line Options
Opening Price Line Options
• New York 8:30 AM Price Line Settings
• Equities Open 9:30 AM Price Line Settings
• Option to Display Historical Price Lines
HTF Levels
• Weekly Open
• Monthly Open
label Settings
• Show/Hide Label Text
• Show/Hide Label
Day of Week
• Show Day of Week at the bottom of chart w/ Time Co-ordinates Selection
••• Message Me For Link to Frequently Updated Version of This Indicator •••
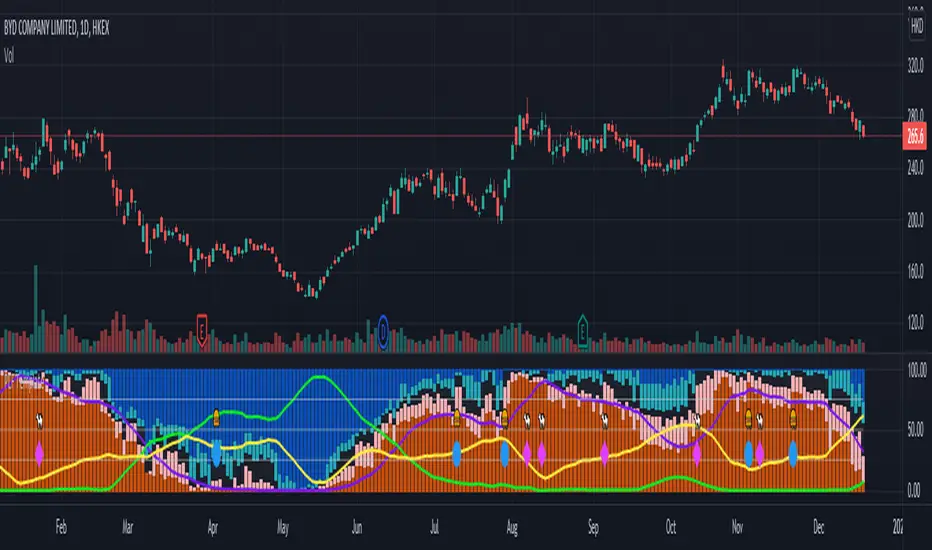
Profit Loss Fund Template ( PLFT / MCDX )Profit Loss Fund Template indicator shows Buyer / Seller activity by calculating series of daily Price & Volume data, over a certain period of time.
It helps to analyse Institution fund's possible behavior with pool of data derived from price volume movement.
RED bar represents percentage of stock holders are currently in profit.
Purple line is RED bar's moving average.
BLUE bar represents percentage of stock holders are currently in loss.
Green line is BLUE bar's moving average.
RED bar > 50% shows institution fund has in control, uptrend is likely easier to continue.
BLUE bar > 50% shows retailer fund is stucked inside, downtrend is likely easier to continue.
Crossing of moving average lines indicates changing of trend (reversal sign):
1) Purple line up-crossed Green line - UPTREND
2) Green line up-crossed Purple line - DOWNTREND
AG FX - INSTITUTIONAL ORDER BLOCKSThis Indicator will help you to find some potential bullish and bearish block.
This indicator, only provides just the the potentials ORDER BLOCKS followed by imbalances.
Forms of using this indicator:
- Plotting the ORDER BLOCKS CANDLES with the color that you prefer
- Plotting the zones given with the ORDER BLOCKS
- Both of them
Indicator Parameters:
- Customizable Candles colors
- Customizable Boxes colors
- Customizable amount of boxes displayed
PD: I just prefer the first one so i can get a clean chart, but it´s up to you.
Inner Circle Trader Institutional ORDER BLOCKS FOREX Theory
Today we are talking about the infamous ORDER BLOCKS by ICT forex trading Strategy. Order Blocks have proven to be a very effective tool in trading as they allow traders to gain high reward with low risk trades.
What is an Order Block? - The Order Block is a specific price range or candle where institutions will be buying or selling against the retail trend/dump money.
Institutions leave order blocks for themselves to trade at a later stage. They will reverse the price to a previous order and then driving the price hard in the direction of the trend (The real institutional trend).
These order blocks we can also call them specific levels of either going Long or Short. If an order block is violated or broken, it now qualifies as a Breaker, meaning Price will retest back to that order block. Sometimes we call it a failed order block.
Types of OBs:
i. Bullish Order Block (BUB)
ii. Bearish Order Block (BEB)

NSDT Institution Trading ZoneA simple script that adds background color to highlight the Institutional Trading Hours during the USA market (8am-4pm Eastern). Timeframes and colors can be modified as needed.
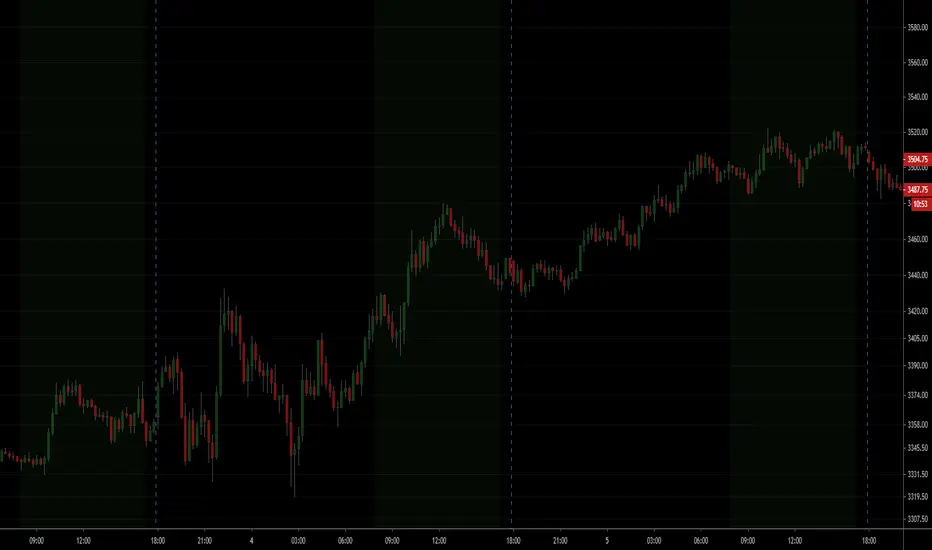
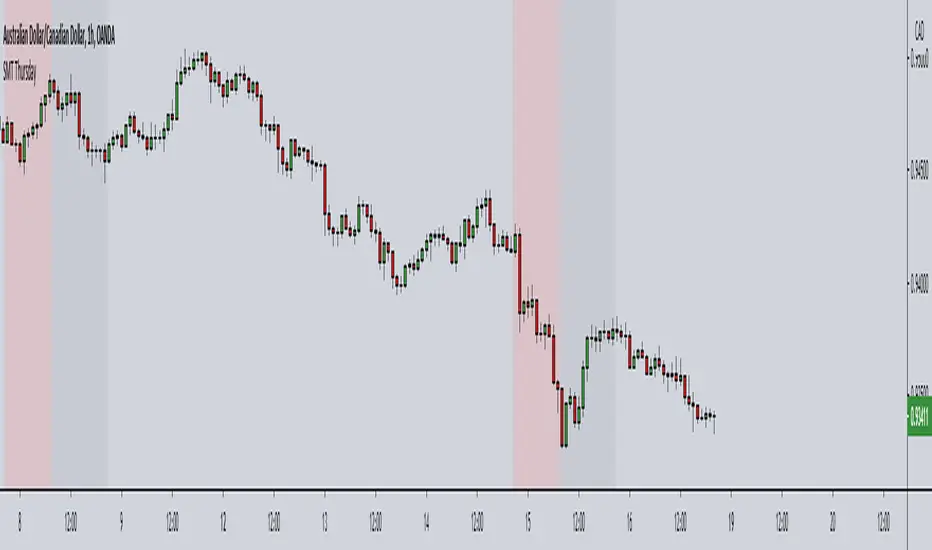
SMT - Smart Money Thursday Boxes
The Smart Money Trading Thursday - is a very specific trading system. You only trade it on a Thursday.
The script/indicator will color Thursdays as two boxes. If you just want one color, use same color for
both boxes. The boxes is there to indicate London/New York sessions.
SETTINGS
In the setting you find a numeric value as 1700-0400:5
The "5" indicate Thursday. You can change that if you prefer to color another specific day.
For example "4" would indicate Wednesday. And you can change the hours to fit your
sessions and trading style.
You can also use the 2 boxes on different days. If you for example would like to color up
London for Wednesday and Thursday. Then set hours to fit London session and adjust the
:5 to 4 on the 1st box and 5 on the 2nd.
HOW TO USE IT?
The Smart Money works in a way retail trading does not. Smart Money has an objective
to locate retail patterns, where there will be a lot of stop loss volume to be grabbed.
So when a retail trader see a setup like a "Double Top / Bottom". The Institutional
will see $$$ of dumb money, ready to be taken. The best moves happen on a Thursday
but if you are a skilled trader, you can see the move also occur on Wednesday or Friday.
The first thing that will happen, is that the Smart Money Breaks out of session. Meaning
they will leave the current weeks high/low range. To start collect negative contracts
of the retail volume.
When you see that happen. And you see a breakout that consist of 4 in a row 1 hour
chart candles. Then you have your first rule meet.
#1 Thursday breakout of current weeks high/low. And the move is a clean 4 hour move
as 4x H1 candles. The move can start within range. But must end clearly outside.
Visual Example:
#2 Next, we await an engulf at peak or near peak. That is where Institutional
may have problem to match any more contracts, and since they used their own
money to make this move. They must now mitigate orders, and return back to
the original retail pattern as most retail traders are now stopped out.
(Normally this is a long/clear candle out of range. they rarely go lower
then retail traders entry in the 1st push. This to not save any souls :)
#3 Price returns back to where the breakout from the retail happens.
You can now take your profit as a Smart Money Trader. Trading with less risk,
you can take profit of the return of that latest 4x H1 candle move. (Order
Block)
CONCLUSION
The best trade is when you can combine a retail pattern, followed by a
breakout which holds 4x 1 hour candles in the outbreak direction.
2nd best is when you have the 4x H1 breakout and really no clear retail
pattern. Still is the same game. Just not as clear as the one above.
Study the steps in this image and you see what to look after:
Good Luck with your trading!
Regards,
The Hunter Trading Group
BullTrading SwingHigh/SwingLowTraders, good afternoon... are you in a mood for an excellent Institutional Trading Course?
Best of all for FREE!! (please use this valuable information with respect, there are people selling the information contained in this course as their own).
This guy has more than 20 years of trading experience under his belt. This information is a real gem for any trader, no matter the timeframe you trade. This script is a tribute for ICT production and shows the swing highs and swing lows used on institutional trading (Use it in D and 4H timeframes resolution for analysis in order to apply manual trading in lower timeframes).
Here is the link to the ICT Sniper Institutional Trading Course. Enjoy www.dropbox.com
