Combo Backtest 123 Percent change bar This is combo strategies for get a cumulative signal.
First strategy
This System was created from the Book "How I Tripled My Money In The
Futures Market" by Ulf Jensen, Page 183. This is reverse type of strategies.
The strategy buys at market, if close price is higher than the previous close
during 2 days and the meaning of 9-days Stochastic Slow Oscillator is lower than 50.
The strategy sells at market, if close price is lower than the previous close price
during 2 days and the meaning of 9-days Stochastic Fast Oscillator is higher than 50.
Second strategy
This histogram displays price or % change from previous bar.
WARNING:
- For purpose educate only
- This script to change bars colors.
M-oscillator
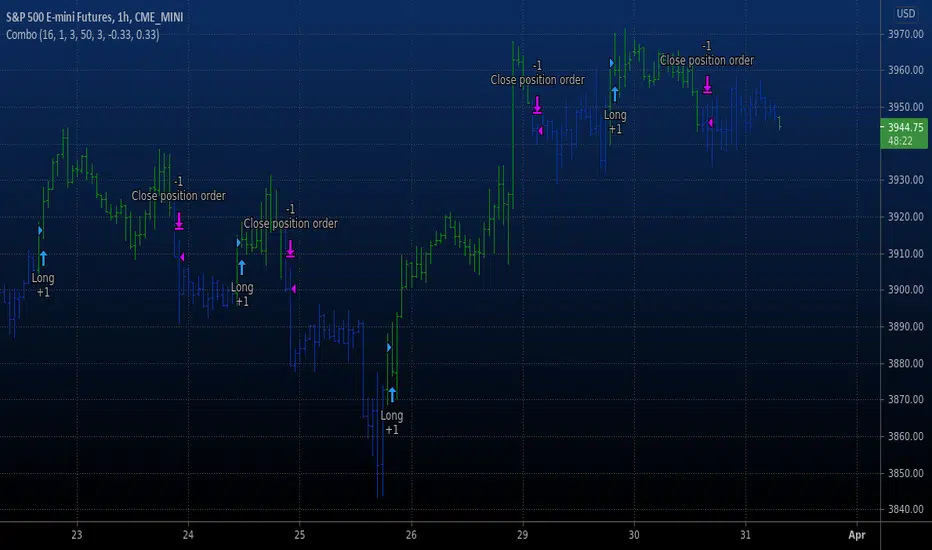
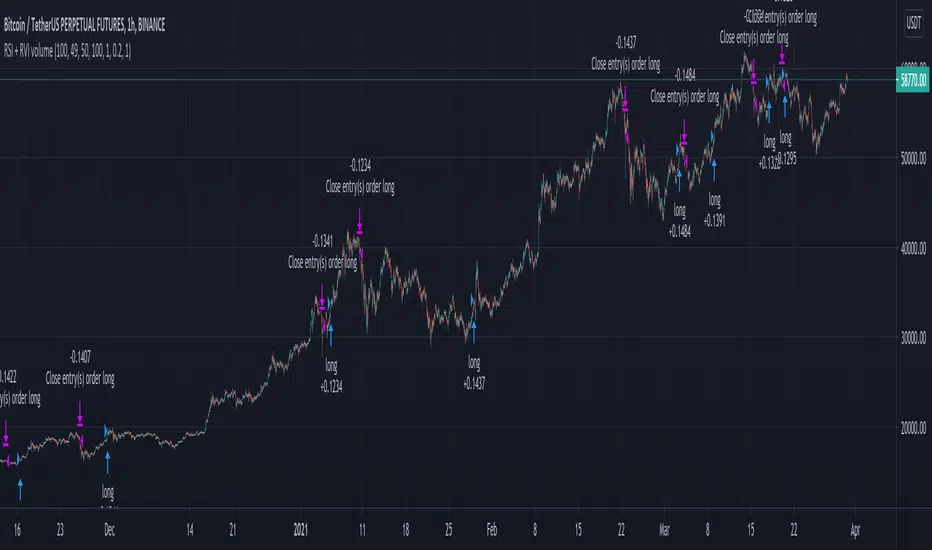
RSI and RVI on volume crypto BTC This strategy combine special version of RSI and RVI , where in this case , I am using the volume , for measuring the speed and change of volume to the price both up and down size together with the volatility spikes.
In this case instead of looking at the volume or volatility, I am combining them into one oscillator.
For best usage, I believe a big length of candles like 100 can get better results, and use it in this way as a lagging indicator.
Since most of the tests I made for futures, I applied a risk management in % of the price movement. For stop loss we have 20% while for TP, 100%. However in both cases, we will exit sooner, and thats going to be when condition from the oscillator says so.
For this we have a middle level, 50, which will act as both overbought and oversold areas.
At the same time I apply the posibility of using leverage into size calculations for more precise tests and try to get min-max out of it.
If you have any questions, please let me know !
Volume RSI Crypto This is a special version RSI, in this case , I am using the volume, which is measuring the speed and change of volume to the price both up and down size.
Volume RSI attempts to gauge price trend changes via changes in bullish and bearish movements.
Its formula is :
VoRSI = 100 - 100 / (1 + VoRS)
where VoRS is Volume Relative Strength over specified period which is calculated as a ratio between averages of Up-Volumes and Down-Volumes:
VoRS = (Average Up-Volume) / (Average Down-Volume)
The logic for this strategy is simple
We entry long when we have a crossover with the Overbought level and we entry short when we have a crossunder with oversold level.
If you have any questions, please let me knw !

Combo Backtest 123 Overbought/Oversold This is combo strategies for get a cumulative signal.
First strategy
This System was created from the Book "How I Tripled My Money In The
Futures Market" by Ulf Jensen, Page 183. This is reverse type of strategies.
The strategy buys at market, if close price is higher than the previous close
during 2 days and the meaning of 9-days Stochastic Slow Oscillator is lower than 50.
The strategy sells at market, if close price is lower than the previous close price
during 2 days and the meaning of 9-days Stochastic Fast Oscillator is higher than 50.
Second strategy
Simple Overbought/Oversold indicator
WARNING:
- For purpose educate only
- This script to change bars colors.

CRYPTO RVI FUTURE 1HThis is a crypto strategy adapted for the futures pairs, especially the perpusdt ones from binance for 1h time frame.
The main component here is the RVI, which is a modified form of the RSI indicator. The RVI, measures more the general direction of the volatility, and can get the trends far smoother than the RSI.
The logic inside is the same like we would normally do with RSI, we check for overbought and oversold levels, and based of that we have an entry or exit depending if we go long or short.
I have tested this product with all the pairs from PERPUSDT from binance and seems to works with the majority of them, of course on some better than the others.
If there are any questions, please let me know !

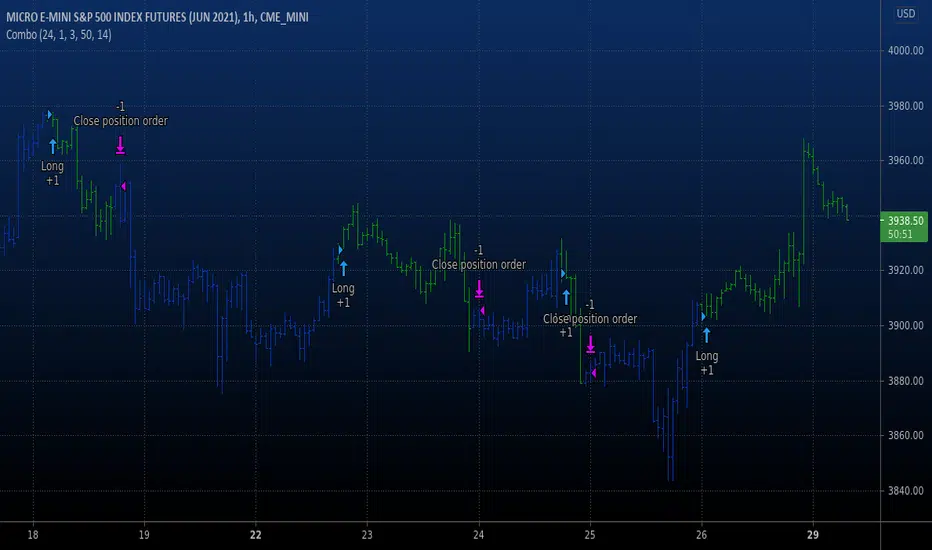
Crypto rsi cci mf stoch rsi oscillators all in one strategyThis is a strategy based on the popular oscillator like RSI, CCI, MF and Stochastic RSI oscillators.
In this situation I use a very high length , 100 candles, and the middle point between overbought and oversold levels at 50.
The entry for long is when all oscilators are above 50, and the exit is when they are below 50 + plus some minor modifications
If you have any questions, please message me a private message !

Combo Backtest 123 Negative Volume Index This is combo strategies for get a cumulative signal.
First strategy
This System was created from the Book "How I Tripled My Money In The
Futures Market" by Ulf Jensen, Page 183. This is reverse type of strategies.
The strategy buys at market, if close price is higher than the previous close
during 2 days and the meaning of 9-days Stochastic Slow Oscillator is lower than 50.
The strategy sells at market, if close price is lower than the previous close price
during 2 days and the meaning of 9-days Stochastic Fast Oscillator is higher than 50.
Second strategy
The theory behind the indexes is as follows: On days of increasing
volume, you can expect prices to increase, and on days of decreasing
volume, you can expect prices to decrease. This goes with the idea of
the market being in-gear and out-of-gear. Both PVI and NVI work in similar
fashions: Both are a running cumulative of values, which means you either
keep adding or subtracting price rate of change each day to the previous day`s
sum. In the case of PVI, if today`s volume is less than yesterday`s, don`t add
anything; if today`s volume is greater, then add today`s price rate of change.
For NVI, add today`s price rate of change only if today`s volume is less than
yesterday`s.
WARNING:
- For purpose educate only
- This script to change bars colors.
RSMI have published that script not like oscillator, which in fact it is, because tradingview doesn't support dual plots in overlay=true and overlay=false. So I have decided that to show filter is better idea. Yes, it decrease potential profit on long term, but for me personally, it is much better to understand the direction of the market movement and take potential trades more seriously. Also about this script: in general based on RSI and works pretty nice on 1H timeframe. Yes, theoretically it can work on both 4H and 1D timeframes, but for this you need to change the settings that are not displayed in the inputs (I did not add them, due to the fact that they can be confusing, because I decided to add a filter). And about filter - it is one of the variations of the SuperTrend. According to House Rules, I cannot insert links here, but only if you are interested in trying this work in auto trading, you can follow the link (located even lower) and find there an algorithm with the same name.

Linear trendThis oscillator based on linear regression . By subtracting the slower LMA from the faster LMA we can get a value, which we will further compare with zero. If the resulting difference is greater than 0, then we can assume that the trend is upward. Also by using offset we could increase the expected profit (focusing on backtest data).
You could get access for this script by the link below.
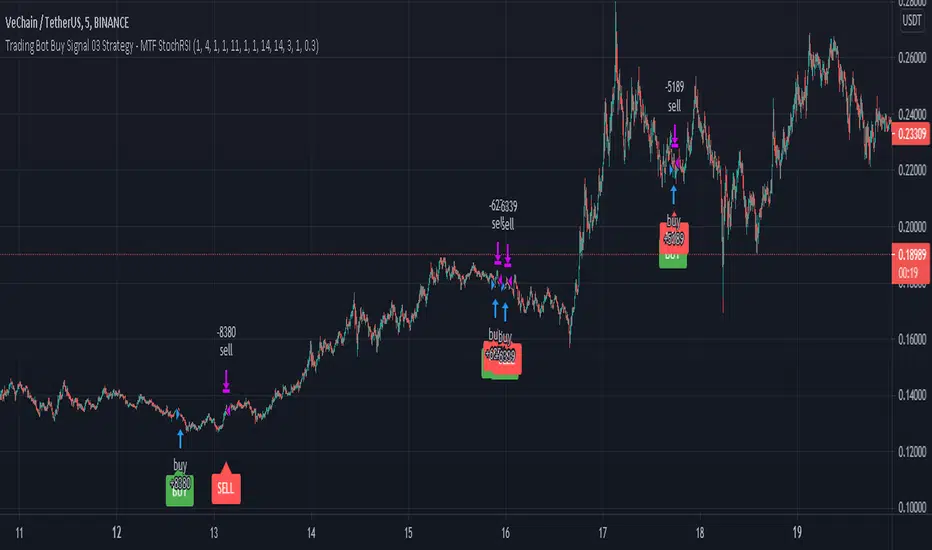
Trading Bot Buy Signal 03 Strategy - MTF StochRSIWelcome to our third Tradingview strategy.
We develop signals which have been specially developed for crypto trading bots. We publish new indicators at regular intervals.
This strategy is based on our "Trading Bot Buy Signal 03 - MTF StochRSI" indicator, so that you can apply and test this strategy to your charts/pairs.
The basic idea of this script is to use the stochastic RSI indicator in multiple Timeframes. When all selected timeframes show an oversold and in 5 Min Timeframe is an crossover, it triggers a solid buy signal. This strategy is relatively robust against false breakouts, even if these can of course never be avoided. These signals occur relatively rare, but you can set an alarm up on different pairs simultaneously. The strategy needs to be set up in 5 min chart cause of an additional crossover buy condition. It wasnt tested in Forex etc. but feel free to test it.
The sell strategy is based on trailing sell and not indicator based cause we believe in the power of long term uptrending crypto, compounding and dont want to sell at a loss in a false breakout. You can set the trailing sell limit to your own preferences or leave it at default value. Our goal is to reduce the average coin holding time to a minimum.
This strategy using different timeframes so it is sending a repainting warning. Cause it calculates values in a different timeframe. But thats normal and it wont recalculate results.
Feel free to adjust the parameters to your preferences:
- Adjust the values of Stoch - K and Length of RSI and Main Stoch to change the sensitivity of the indicator
- Turn on different timeframes or leave default timeframes
- Adjust the oversold Limit of the StochRSI indicator to change results
- Adjusting the trailing sell parameters influences the coin holding time and the results
If there are questions, write them into the comments or contact us directly over the direct message. Happy Trading!
Combo Backtest 123 Reversal & N Bars Up This is combo strategies for get a cumulative signal.
First strategy
This System was created from the Book "How I Tripled My Money In The
Futures Market" by Ulf Jensen, Page 183. This is reverse type of strategies.
The strategy buys at market, if close price is higher than the previous close
during 2 days and the meaning of 9-days Stochastic Slow Oscillator is lower than 50.
The strategy sells at market, if close price is lower than the previous close price
during 2 days and the meaning of 9-days Stochastic Fast Oscillator is higher than 50.
Second strategy
Evaluates for n number of consecutive higher closes. Returns a value
of 1 when the condition is true or 0 when false.
WARNING:
- For purpose educate only
- This script to change bars colors.

Trading Bot Buy Signal 02 Strategy - MTF StochasticWelcome to our second Tradingview strategy.
We develop signals which have been specially developed for crypto trading bots. We publish new indicators at regular intervals.
This strategy is based on our "Trading Bot Buy Signal 02 - MTF Stochastic" indicator, so that you can apply and test this strategy to your charts/pairs.
The basic idea of this script is to use the stochastic indicator in multiple Timeframes. When all selected timeframes show an oversold it triggers a solid buy signal. This strategy is relatively robust against false breakouts, even if these can of course never be avoided. These signals occur relatively rare, but you can set an alarm up on different pairs simultaneously. The strategy works best in 5 min chart and in crypto pairs. It wasnt tested in Forex etc. but feel free to test it.
The sell strategy is based on trailing sell and not indicator based cause we believe in the power of long term uptrending crypto, compounding and dont want to sell at a loss in a false breakout. You can set the trailing sell limit to your own preferences or leave it at default value. Our goal is to reduce the average coin holding time to a minimum.
This strategy using different timeframes so it is sending a repainting warning. Cause it calculates values in a different timeframe. But thats normal and it wont recalculate results.
Feel free to adjust the parameters to your preferences:
- Adjust the values of Stoch - K and Stoch - D to change the sensitivity of the indicator
- Turn on different timeframes or leave default timeframes
- Adjust the threshold value of the stoch indicator to change results
- Adjusting the trailing sell parameters influences the coin holding time and the results
If there are questions, write them into the comments or contact us directly over the direct message. Happy Trading!

Dankland Playground DCAing multi-strategy OPThis is essentially a script that I made for myself before deciding it may be good enough for you all as well.
How it works basically is this... you have 18 oscillators which can all be used as independently as you wish. That means there are 20 groups which they can be split amongst as you choose.
When in separate groups they should not be able to sell eachothers positions without triggering a stop loss. Every single oscillator has its own position sizing and exit sizing which can be stated as either a percent of balance or a flat amount of contracts. Each oscillator has a minimum amount of profit you can tell it to sell it, which is calculated from the average cost of your current position, which does include all groups. This works out to help you average out better entry and exit prices, essentially a method of DCAing.
You can set the minimum sale amount, which is to keep it from placing orders below your exchanges minimum dollar trade cost.
The included oscillators are as follows:
Chande Momentum cross
Moving Average Cross
MACD cross
%B Bollinger cross
Stochastic cross + region filter
Stochastic RSI cross + region filter
SMII cross and region
Three RMIs
Standard RSI
LSMA-smoothed RSI
Know Sure Thing
RSI of KST
Coppock Curve
RSI of Curve
PPO
RSI of PPO
Trix
RSI of Trix
So the idea is that this is essentially multiple strategies combined into one backtestable house. Balance is calculated for all position sizes in order to try to prevent false entries that plague so many scripts (IE, you set pyramiding to 2, each buy $1000, initial balance $1000, and yet it buys two orders off the bat for $2000 total and nets 400% profit because the second was considered free)/
You tune each side and position size them so that they work together as well as you can and in doing so you are able to create a single backtest that is capable of running a bot, essentially, between multiple strategies - you can run a slower Moving Average cross, a faster SMI cross or MACD, or Bollinger that grabs big moves only, all the while having MACD trade small bonuses along the way. This way you can weight the Risk to Reward of each against eachother.
I will not try to claim this is something you can open and with no work have the best bot on the planet. This scripts intention is to take a lot of relatively common trading strategies and combine them under on roof with some risk management and the ability to weigh each against eachother.
If you are looking for a super advanced singular algorithm that tries to capture every peak and valley exactly on the dot, this is not for you. If you are looking for a tool with a high level of customizability, with a publisher who intends to update it to the best of his ability in accordance to seeking to make the best product that I personally can make for both myself and the community (because I will be using this myself of course!) that was specifically designed with the intention of performing well in spot markets by averaging low entry costs and high exit costs, this is for you! That is the exact intention here.
I do not trade margin currently, I trade spot. I am sure this script can be tuned to work on margin but this is not my intention or area so if this is you and there is something you need for margin specifically implemented, ask, because I likely don't know what you need yet.
The current backtest shown is hand-optimized by myself for BTC/USD 1hr market with NO stop loss enabled and all sales weighed to be around 0% minimum profit from the total average entry cost.
I chose to run it myself with no stop losses because Bitcoin is so bullish to me. The stop losses can still be very profitable, but not 1495% net profit. This style of automation is not for everyone as when running with no stop loss and the requirement every sale is somewhat profitable, or at least no very noticeable loss, you wind up relying on yourself to manually stop out if things crash too much and the bot has to stop trading to wait for market to go back up. The thing to do here if you are playing without a stop loss is to have your own alerts set at your fear level, a % drop in a period of time or something like that, and when you reach that point I would consider resetting the bot so it continues to take trades. I personally will accept a temporary drop in USD as long as I can keep my BTC holdings up overall as the goal should always be to have as many BTC as possible by the start and end of the bull run.

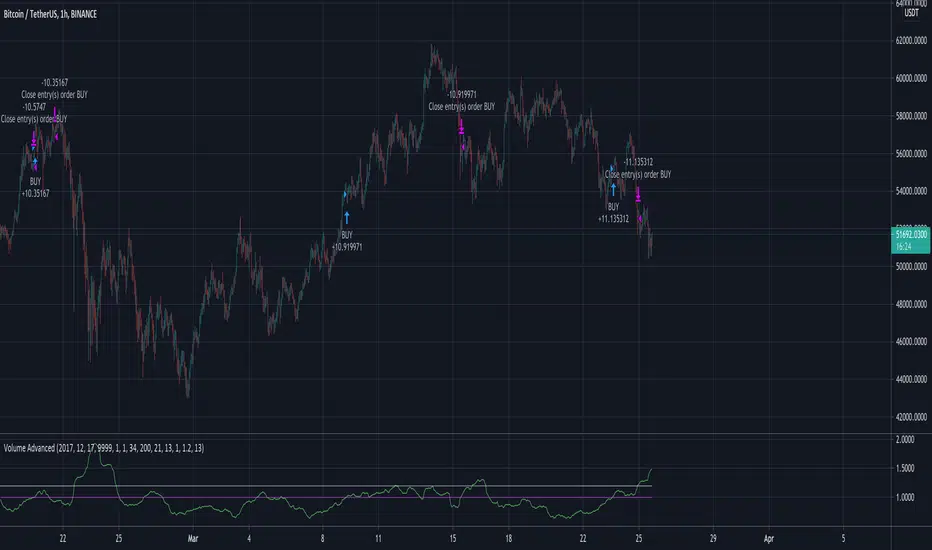
Volume AdvancedI have found out this script some time ago. In fact it is not my code (just have modified a little) and I don't know the author (couldn't find). So now I would like to share with the community, maybe somebody would have some idea how to make it better. The script itself is modified volatility oscillator (like ATR) based on volume, making a deal at the moment of price change. To recognize the current trend I have add simple function just to compare the current price with the N bars before, because sometimes in moments of high volatility there may be wrong signals.
Combo Backtest 123 Reversal & N Bars Down This is combo strategies for get a cumulative signal.
First strategy
This System was created from the Book "How I Tripled My Money In The
Futures Market" by Ulf Jensen, Page 183. This is reverse type of strategies.
The strategy buys at market, if close price is higher than the previous close
during 2 days and the meaning of 9-days Stochastic Slow Oscillator is lower than 50.
The strategy sells at market, if close price is lower than the previous close price
during 2 days and the meaning of 9-days Stochastic Fast Oscillator is higher than 50.
Second strategy
Evaluates for n number of consecutive lower closes. Returns a value
of 1 when the condition is true or 0 when false.
WARNING:
- For purpose educate only
- This script to change bars colors.

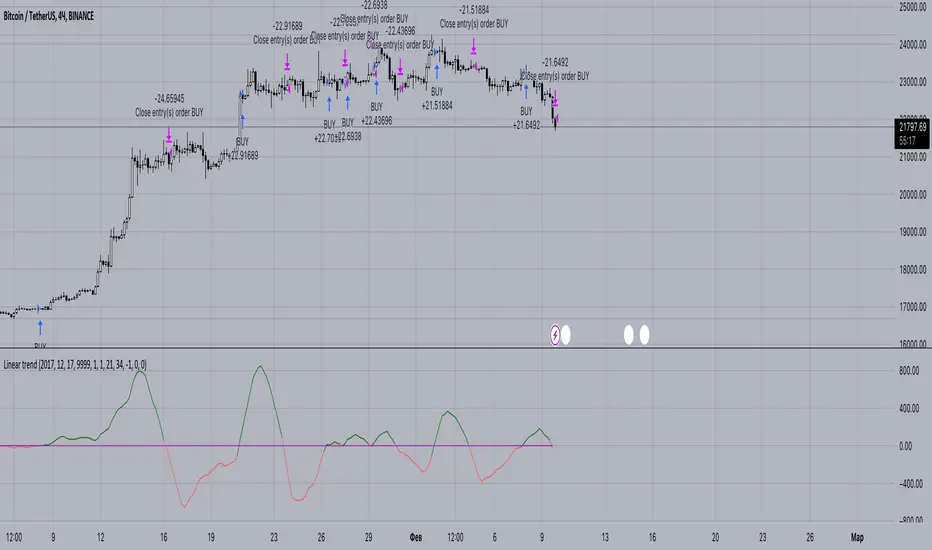
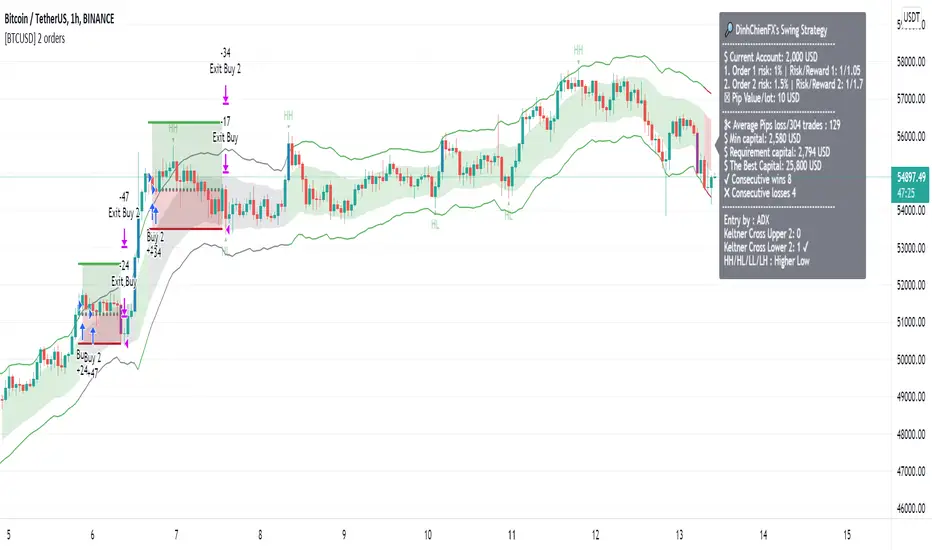
[BTCUSD] DinhChienFX [2 orders]* Historical statistics from 2018:
* Strategy will enter 2 orders, Order 2 will appear only when there is Order 1:
- Percent profitable of 1st order: 64.76%.
- Percent profitable of 2nd order: 49.86%.
- Average percent profitable: 57.31%.
- 14 consecutive wins.
- 4 consecutive losses.
Order 1: risk / reward ratio 1/1 used to determine if this rule is effective or not?
Order 2: Appears when there is order 1, Use take-profit and take-loss level of order 1 at Fibonacci 75%.
. * 1st Order conditions:
- Buy: When the ADX index cuts up to 45, check earlier if the closing price has cut up and is above the Upper 2 line, enter the Buy order.
- Sell: when the ADX indicator cuts up to 45, check before that if the closing price has cut down and is above Lower 2 then enter a Sell order.
* How to enter Order 2: When order 1 appears, there are always Stoploss and Takeprofit levels. Draw Fibonacci from take-profit and take-loss prices, Fibonacci retracement level = 75%
----------------
1. Trend identification:
- Channel Keltner:
... Uptrend: when the closing candlestick cuts up and is above the Keltner channel, the Upper Line 2
... Down trend: when the candle closes and falls above the Keltner Line Lower 2
2. Rules of entry:
- Channel Keltner:
... Buy: Candlestick closing price cuts up and above the Keltner Upper 2.
... Sell: The closing price of the candle cuts down and is lower than the Keltner Below 2.
ADX indicator:
... Buy: The ADX value crossed to 45 and the close of the candle was higher than Keltner Upper 2.
... Sell: ADX value cuts to 45 and the close of the candle is lower than Keltner Below 2.
3. Stoploss and Profit = atr (20) * 2.
HatiKO Envelopes v3Published source code is subject to the terms of the GNU Affero General Public License v3.0
Old flaws have been resolved.
This script describes and provides backtesting functionality to internal strategy of algorithmic crypto trading software "HatiKO bot".
Suitable for backtesting any Cryptocurrency Pair on any Exchange/Platform, any Timeframe.
Core Mechanics of this strategy are based on theory of price always returning to Moving Average + Envelopes indicator (Moving_average_envelope from Wiki)
Developement of this script and trading software is inspired by:
"Essential Technical Analysis: Tools and Techniques to Spot Market Trends" by Leigh Stevens (published on 12th of April 2002)
"Moving Average Envelopes" by ChartSchool, StockCharts platform (published on 13th of April 2015 or earlier)
"Коля Колеснік" from Crypto Times channel ("Метод сетка", published on 19th of August 2018)
"3 ways to use Moving Average Envelopes" by Rich Fitton, published on Trader's Nest (published on 28st of November 2018 or earlier)
noro's "Robot WhiteBox ShiftMA" strategy v1 script, published on TradingView platform (published on 29th of August 2018)
"Moving Average Envelopes: A Popular Trading Tool" Investopedia article (published 25th of June 2019)
and KROOL1980's blogpost on Argolabs ("Гридерство или Сетка как источник прибыли на форекс", published on 27th of February 2015)
Core Features:
1) Up to 9 Envelopes in each direction (Long/Short)
2) Use any of 6 different basis MAs, optionally use different MAs for Opening and Closure
3) Use different Timeframes for MA calculation, without any repainting and lookahead bias.
4) Fixed order size, not Martingale strategy
5) Close open position earlier by using Deviation parameter
6) PineScript v4 code
7) Anti-Spire (protection against situations like LTCUSD (Bitmex) 12/26/2020)
9) Lottery for each level
10) Total profit for the day. When activated, a histogram is drawn.
Options description:
Lot - % from your initial balance to use for order size calculation
Timeframe Short - Timeframe to use for Short Opening MA calculation, can be chosen from dropdown list, default is Current Graph Timeframe
MA Type Short - Type of MA to use for Short Opening MA calculation, can be chosen from dropdown list, default is SMA
Data Short - Source of Price for Short Opening MA calculation, can be chosen from dropdown list, default is OHLC4
MA Length Short - Period used for Short Opening MA calculation, should be >=1, default is 3
MA offset Short - Offset for MA value used for Short Envelopes calculation, should be >= 0, default is 0
Timeframe Long - Timeframe to use for Long Opening MA calculation, can be chosen from dropdown list, default is Current Graph Timeframe
MA Type Long - Type of MA to use for Long Opening MA calculation, can be chosen from dropdown list, default is SMA
Data Long - Source of Price for Long Opening MA calculation, can be chosen from dropdown list, default is OHLC4
MA Length Long - Period used for Long Opening MA calculation, should be >=1, default is 3
MA offset Long - Offset for MA value used for Long Envelopes calculation, should be >= 0, default is 0
Mode close MA Short - Enable different MA for Short position Closure, default is "false". If false, Closure MA = Opening MA
Timeframe Short Close - Timeframe to use for Short Position Closure MA calculation, can be chosen from dropdown list, default is Current Graph Timeframe
MA Type Close Short - Type of MA to use for Short Position Closure MA calculation, can be chosen from dropdown list, default is SMA
Data Short Close - Source of Price for Short Closure MA calculation, can be chosen from dropdown list, default is OHLC4
MA Length Short Close - Period used for Short Opening MA calculation, should be >=1, default is 3
Short Deviation - % to move from MA value, used to close position above or beyond MA, can be negative, default is 0
MA offset Short Close - Offset for MA value used for Short Position Closure calculation, should be >= 0, default is 0
Mode close MA Long - Enable different MA for Long position Closure, default is "false". If false, Closure MA = Opening MA
Timeframe Long Close - Timeframe to use for Long Position Closure MA calculation, can be chosen from dropdown list, default is Current Graph Timeframe
MA Type Close Long - Type of MA to use for Long Position Closure MA calculation, can be chosen from dropdown list, default is SMA
Data Long Close - Source of Price for Long Closure MA calculation, can be chosen from dropdown list, default is OHLC4
MA Length Long Close - Period used for Long Opening MA calculation, should be >=1, default is 3
Long Deviation - % to move from MA value, used to close position above or beyond MA, can be negative, default is 0
MA offset Long Close - Offset for MA value used for Long Position Closure calculation, should be >= 0, default is 0
Short 1..9 - % from MA value to put Envelopes at, for Shorts numbers should be positive, the higher is number, the higher should be Short n position, example: "Short 1 = 1, Short 2 = 2, etc."
Long 1..9 - % from MA value to put Envelopes at, for Longs numbers should be negative, the lower is number, the lower should be Long n position, example: "Long 1 = -1, Long 2 = -2, etc."
Graph notes:
Green lines - Long Envelopes .
Red lines - Short Envelopes .
Orange line - MA for closing of Short positions.
Lime line - MA for closing of Long positions.
Histogram - Profit for the last day. Black = 0, Green> 0, Red <0.
Old flaws have been resolved.
At the moment, there is one bug - if the closing and opening occurs on the same candle, then there is no close on the same candle. The situation is possible with small values of Envelope.
**************************************************************************************************************************************************************************************************************
Опубликованный исходный код регулируется Условиями Стандартной Общественной Лицензии GNU Affero v3.0
Старые недоработки были решены.
Этот скрипт описывает и предоставляет функции бектеста для внутренней стратегии алгоритмического программного обеспечения "HatiKO bot".
Подходит для тестирования любой криптовалютной пары на любой бирже/платформе, на любом таймфрейме.
Кор-механика этой стратегии основана на теории всегда возвращающейся к значению МА цены с использованием индикатора Envelopes (Moving_average_envelope from Wiki)
Разработка этого скрипта и программного обеспечения для торговли вдохновлена следующими источниками:
Книга "Essential Technical Analysis: Tools and Techniques to Spot Market Trends" Ли Стивенса (опубликовано 12 апреля 2002 года)
«Moving Average Envelopes» от ChartSchool, платформа StockCharts (опубликовано 13 апреля 2015 года или раньше)
«Коля Колеснік» с канала Crypto Times («Метод сетка», опубликовано 19 августа 2018 года)
«Moving Average Envelopes: A Popular Trading Tool», статья Investopedia (опубликовано 25 июня 2019 года)
Блог KROOL1980 из Argolabs («Гридерство или Сетка как источник прибыли на форекс», опубликовано 27 февраля 2015 года)
Основные особенности:
1) До 9-х Ордеров в каждом из направлении (Лонг / Шорт)
2) Выбор из 6-ти разных базовых МА, опционально используйте разные МА для открытия и закрытия.
3) Используйте разные таймфреймы для расчета MA, без перерисовки и "эффекта стеклянного шара".
4) Фиксированный размер ордера, а не стратегия Мартингейла
5) Возможность закрытия открытой позиции заблаговременно, используя параметр Deviation
6) Код реализован на PineScript v4
7) Антишпиль ( защита от ситуаций типа LTCUSD ( Bitmex ) 26.12.2020 )
9) Лотность для каждого уровня
10) Суммарный профит за день. При активации рисуется гистограмма.
Описание параметров:
Lot - % от вашего первоначального баланса, используется при расчете размера Ордера
Timeframe Short - таймфрейм, используемый для расчета МА Открытия Шорт позиций, может быть выбран из списка, по умолчанию - таймфрейм текущего графика
MA Type Short - тип MA, используемый для расчета МА Открытия Шорт позиций, может быть выбран из списка, по умолчанию SMA
Data Short - источник цены для расчета МА Открытия Шорт позиций, может быть выбран из списка, по умолчанию OHLC4
MA Length Short - период, используемый для расчета МА Открытия Шорт позиций, должен быть >= 1, по умолчанию 3
MA Offset Short - смещение значения MA, используемого для расчета Шорт Ордеров, должно быть >= 0, по умолчанию 0
Timeframe Long - таймфрейм, используемый для расчета МА Открытия Лонг позиций, может быть выбран из списка, по умолчанию - таймфрейм текущего графика
MA Type Long - тип MA, используемый для расчета МА Открытия Лонг позиций, может быть выбран из списка, по умолчанию SMA
Data Long - источник цены для расчета МА Открытия Лонг позиций, может быть выбран из списка, по умолчанию OHLC4
MA Length Long - период, используемый для расчета МА Открытия Лонг позиций, должен быть >= 1, по умолчанию 3
MA Offset Long - смещение значения MA, используемого для расчета Лонг Ордеров, должно быть >= 0, по умолчанию 0
Mode close MA Short - Включает отдельное MA для закрытия Шорт позиции, по умолчанию «false». Если false, MA Закрытия = MA Открытия
Timeframe Short Close - таймфрейм, используемый для расчета МА Закрытия Шорт позиций, может быть выбран из списка, по умолчанию - таймфрейм текущего графика
MA Type Close Short - тип MA, используемый при расчете МА Закрытия Шорт позиции. Mожно выбрать из списка, по умолчанию SMA
Data Short Close - источник цены для расчета МА Закрытия Шорт позиций, может быть выбран из списка, по умолчанию OHLC4
MA Length Short Close - период, используемый для расчета МА Закрытия Шорт позиции, должен быть >= 1, по умолчанию 3
Short Deviation - % отклонения от значения MA, используется для закрытия позиции выше или ниже рассчитанного значения MA, может быть отрицательным, по умолчанию 0
MA Offset Short Close - смещение значения MA, используемого для расчета закрытия Шорт позиции, должно быть >= 0, по умолчанию 0
Mode close MA Long - Включает разные MA для закрытия Лонг позиции, по умолчанию «false». Если false, MA Закрытия = MA Открытия
Timeframe Long Close - таймфрейм, используемый для расчета МА Закрытия Лонг позиций, может быть выбран из списка, по умолчанию - таймфрейм текущего графика
MA Type Close Long - тип MA, используемый при расчете МА Закрытия Лонг позиции. Mожно выбрать из списка, по умолчанию SMA
Data Long Close - источник цены для расчета МА Закрытия Лонг позиций, может быть выбран из списка, по умолчанию OHLC4
MA Length Long Close - период, используемый для расчета МА Закрытия Лонг позиции, должен быть >= 1, по умолчанию 3
Long Deviation -% для перехода от значения MA, используется для закрытия позиции выше или ниже рассчитанного значения MA, может быть отрицательным, по умолчанию 0
MA Offset Long Close - смещение значения MA, используемого для расчета закрытия Лонг позиции, должно быть >= 0, по умолчанию 0
Short 1..9 - % от значения MA для размещения Ордеров, для Шорт Ордеров должен быть положительным, чем выше номер, тем выше должна располагаться позиция Short n, например: « Short 1 = 1, Short 2 = 2 и т.д. "
Long 1..9 - % от значения MA для размещения Ордеров, для Лонг Ордеров должно быть отрицательным, чем ниже число, тем ниже должна располагаться позиция Long n, например: « Long 1 = -1, Long 2 = -2, и т.д."
Пояснения к графику:
Зеленые линии - Лонг Ордера.
Красные линии - Шорт Ордера.
Оранжевая линия - MA Закрытия Шорт позиций.
Лаймовая линия - MA Закрытия Лонг позиций.
Гистограмма - Профит за последние сутки.Черная = 0, Зеленая > 0, красная < 0.
Старые недоработки были решены.
На данный момент есть один баг - если закрытие и открытие происходит на одной свече, то на этой же свече нет закрытия. Ситуация возможна при небольших значениях Envelope.
Published source code is subject to the terms of the GNU Affero General Public License v3.0
Old flaws have been resolved.
This script describes and provides backtesting functionality to internal strategy of algorithmic crypto trading software "HatiKO bot".
Suitable for backtesting any Cryptocurrency Pair on any Exchange/Platform, any Timeframe.
Core Mechanics of this strategy are based on theory of price always returning to Moving Average + Envelopes indicator (Moving_average_envelope from Wiki)
Developement of this script and trading software is inspired by:
"Essential Technical Analysis: Tools and Techniques to Spot Market Trends" by Leigh Stevens (published on 12th of April 2002)
"Moving Average Envelopes" by ChartSchool, StockCharts platform (published on 13th of April 2015 or earlier)
"Коля Колеснік" from Crypto Times channel ("Метод сетка", published on 19th of August 2018)
"3 ways to use Moving Average Envelopes" by Rich Fitton, published on Trader's Nest (published on 28st of November 2018 or earlier)
noro's "Robot WhiteBox ShiftMA" strategy v1 script, published on TradingView platform (published on 29th of August 2018)
"Moving Average Envelopes: A Popular Trading Tool" Investopedia article (published 25th of June 2019)
and KROOL1980's blogpost on Argolabs ("Гридерство или Сетка как источник прибыли на форекс", published on 27th of February 2015)
Core Features:
1) Up to 9 Envelopes in each direction (Long/Short)
2) Use any of 6 different basis MAs, optionally use different MAs for Opening and Closure
3) Use different Timeframes for MA calculation, without any repainting and lookahead bias.
4) Fixed order size, not Martingale strategy
5) Close open position earlier by using Deviation parameter
6) PineScript v4 code
7) Anti-Spire (protection against situations like LTCUSD (Bitmex) 12/26/2020)
9) Lottery for each level
10) Total profit for the day. When activated, a histogram is drawn.
Options description:
Lot - % from your initial balance to use for order size calculation
Timeframe Short - Timeframe to use for Short Opening MA calculation, can be chosen from dropdown list, default is Current Graph Timeframe
MA Type Short - Type of MA to use for Short Opening MA calculation, can be chosen from dropdown list, default is SMA
Data Short - Source of Price for Short Opening MA calculation, can be chosen from dropdown list, default is OHLC4
MA Length Short - Period used for Short Opening MA calculation, should be >=1, default is 3
MA offset Short - Offset for MA value used for Short Envelopes calculation, should be >= 0, default is 0
Timeframe Long - Timeframe to use for Long Opening MA calculation, can be chosen from dropdown list, default is Current Graph Timeframe
MA Type Long - Type of MA to use for Long Opening MA calculation, can be chosen from dropdown list, default is SMA
Data Long - Source of Price for Long Opening MA calculation, can be chosen from dropdown list, default is OHLC4
MA Length Long - Period used for Long Opening MA calculation, should be >=1, default is 3
MA offset Long - Offset for MA value used for Long Envelopes calculation, should be >= 0, default is 0
Mode close MA Short - Enable different MA for Short position Closure, default is "false". If false, Closure MA = Opening MA
Timeframe Short Close - Timeframe to use for Short Position Closure MA calculation, can be chosen from dropdown list, default is Current Graph Timeframe
MA Type Close Short - Type of MA to use for Short Position Closure MA calculation, can be chosen from dropdown list, default is SMA
Data Short Close - Source of Price for Short Closure MA calculation, can be chosen from dropdown list, default is OHLC4
MA Length Short Close - Period used for Short Opening MA calculation, should be >=1, default is 3
Short Deviation - % to move from MA value, used to close position above or beyond MA, can be negative, default is 0
MA offset Short Close - Offset for MA value used for Short Position Closure calculation, should be >= 0, default is 0
Mode close MA Long - Enable different MA for Long position Closure, default is "false". If false, Closure MA = Opening MA
Timeframe Long Close - Timeframe to use for Long Position Closure MA calculation, can be chosen from dropdown list, default is Current Graph Timeframe
MA Type Close Long - Type of MA to use for Long Position Closure MA calculation, can be chosen from dropdown list, default is SMA
Data Long Close - Source of Price for Long Closure MA calculation, can be chosen from dropdown list, default is OHLC4
MA Length Long Close - Period used for Long Opening MA calculation, should be >=1, default is 3
Long Deviation - % to move from MA value, used to close position above or beyond MA, can be negative, default is 0
MA offset Long Close - Offset for MA value used for Long Position Closure calculation, should be >= 0, default is 0
Short 1..9 - % from MA value to put Envelopes at, for Shorts numbers should be positive, the higher is number, the higher should be Short n position, example: "Short 1 = 1, Short 2 = 2, etc."
Long 1..9 - % from MA value to put Envelopes at, for Longs numbers should be negative, the lower is number, the lower should be Long n position, example: "Long 1 = -1, Long 2 = -2, etc."
Graph notes:
Green lines - Long Envelopes .
Red lines - Short Envelopes .
Orange line - MA for closing of Short positions.
Lime line - MA for closing of Long positions.
Histogram - Profit for the last day. Black = 0, Green> 0, Red <0.
Old flaws have been resolved.
At the moment, there is one bug - if the closing and opening occurs on the same candle, then there is no close on the same candle. The situation is possible with small values of Envelope.
**************************************************************************************************************************************************************************************************************
Опубликованный исходный код регулируется Условиями Стандартной Общественной Лицензии GNU Affero v3.0
Старые недоработки были решены.
Этот скрипт описывает и предоставляет функции бектеста для внутренней стратегии алгоритмического программного обеспечения "HatiKO bot".
Подходит для тестирования любой криптовалютной пары на любой бирже/платформе, на любом таймфрейме.
Кор-механика этой стратегии основана на теории всегда возвращающейся к значению МА цены с использованием индикатора Envelopes (Moving_average_envelope from Wiki)
Разработка этого скрипта и программного обеспечения для торговли вдохновлена следующими источниками:
Книга "Essential Technical Analysis: Tools and Techniques to Spot Market Trends" Ли Стивенса (опубликовано 12 апреля 2002 года)
«Moving Average Envelopes» от ChartSchool, платформа StockCharts (опубликовано 13 апреля 2015 года или раньше)
«Коля Колеснік» с канала Crypto Times («Метод сетка», опубликовано 19 августа 2018 года)
«Moving Average Envelopes: A Popular Trading Tool», статья Investopedia (опубликовано 25 июня 2019 года)
Блог KROOL1980 из Argolabs («Гридерство или Сетка как источник прибыли на форекс», опубликовано 27 февраля 2015 года)
Основные особенности:
1) До 9-х Ордеров в каждом из направлении (Лонг / Шорт)
2) Выбор из 6-ти разных базовых МА, опционально используйте разные МА для открытия и закрытия.
3) Используйте разные таймфреймы для расчета MA, без перерисовки и "эффекта стеклянного шара".
4) Фиксированный размер ордера, а не стратегия Мартингейла
5) Возможность закрытия открытой позиции заблаговременно, используя параметр Deviation
6) Код реализован на PineScript v4
7) Антишпиль ( защита от ситуаций типа LTCUSD ( Bitmex ) 26.12.2020 )
9) Лотность для каждого уровня
10) Суммарный профит за день. При активации рисуется гистограмма.
Описание параметров:
Lot - % от вашего первоначального баланса, используется при расчете размера Ордера
Timeframe Short - таймфрейм, используемый для расчета МА Открытия Шорт позиций, может быть выбран из списка, по умолчанию - таймфрейм текущего графика
MA Type Short - тип MA, используемый для расчета МА Открытия Шорт позиций, может быть выбран из списка, по умолчанию SMA
Data Short - источник цены для расчета МА Открытия Шорт позиций, может быть выбран из списка, по умолчанию OHLC4
MA Length Short - период, используемый для расчета МА Открытия Шорт позиций, должен быть >= 1, по умолчанию 3
MA Offset Short - смещение значения MA, используемого для расчета Шорт Ордеров, должно быть >= 0, по умолчанию 0
Timeframe Long - таймфрейм, используемый для расчета МА Открытия Лонг позиций, может быть выбран из списка, по умолчанию - таймфрейм текущего графика
MA Type Long - тип MA, используемый для расчета МА Открытия Лонг позиций, может быть выбран из списка, по умолчанию SMA
Data Long - источник цены для расчета МА Открытия Лонг позиций, может быть выбран из списка, по умолчанию OHLC4
MA Length Long - период, используемый для расчета МА Открытия Лонг позиций, должен быть >= 1, по умолчанию 3
MA Offset Long - смещение значения MA, используемого для расчета Лонг Ордеров, должно быть >= 0, по умолчанию 0
Mode close MA Short - Включает отдельное MA для закрытия Шорт позиции, по умолчанию «false». Если false, MA Закрытия = MA Открытия
Timeframe Short Close - таймфрейм, используемый для расчета МА Закрытия Шорт позиций, может быть выбран из списка, по умолчанию - таймфрейм текущего графика
MA Type Close Short - тип MA, используемый при расчете МА Закрытия Шорт позиции. Mожно выбрать из списка, по умолчанию SMA
Data Short Close - источник цены для расчета МА Закрытия Шорт позиций, может быть выбран из списка, по умолчанию OHLC4
MA Length Short Close - период, используемый для расчета МА Закрытия Шорт позиции, должен быть >= 1, по умолчанию 3
Short Deviation - % отклонения от значения MA, используется для закрытия позиции выше или ниже рассчитанного значения MA, может быть отрицательным, по умолчанию 0
MA Offset Short Close - смещение значения MA, используемого для расчета закрытия Шорт позиции, должно быть >= 0, по умолчанию 0
Mode close MA Long - Включает разные MA для закрытия Лонг позиции, по умолчанию «false». Если false, MA Закрытия = MA Открытия
Timeframe Long Close - таймфрейм, используемый для расчета МА Закрытия Лонг позиций, может быть выбран из списка, по умолчанию - таймфрейм текущего графика
MA Type Close Long - тип MA, используемый при расчете МА Закрытия Лонг позиции. Mожно выбрать из списка, по умолчанию SMA
Data Long Close - источник цены для расчета МА Закрытия Лонг позиций, может быть выбран из списка, по умолчанию OHLC4
MA Length Long Close - период, используемый для расчета МА Закрытия Лонг позиции, должен быть >= 1, по умолчанию 3
Long Deviation -% для перехода от значения MA, используется для закрытия позиции выше или ниже рассчитанного значения MA, может быть отрицательным, по умолчанию 0
MA Offset Long Close - смещение значения MA, используемого для расчета закрытия Лонг позиции, должно быть >= 0, по умолчанию 0
Short 1..9 - % от значения MA для размещения Ордеров, для Шорт Ордеров должен быть положительным, чем выше номер, тем выше должна располагаться позиция Short n, например: « Short 1 = 1, Short 2 = 2 и т.д. "
Long 1..9 - % от значения MA для размещения Ордеров, для Лонг Ордеров должно быть отрицательным, чем ниже число, тем ниже должна располагаться позиция Long n, например: « Long 1 = -1, Long 2 = -2, и т.д."
Пояснения к графику:
Зеленые линии - Лонг Ордера.
Красные линии - Шорт Ордера.
Оранжевая линия - MA Закрытия Шорт позиций.
Лаймовая линия - MA Закрытия Лонг позиций.
Гистограмма - Профит за последние сутки.Черная = 0, Зеленая > 0, красная < 0.
Старые недоработки были решены.
На данный момент есть один баг - если закрытие и открытие происходит на одной свече, то на этой же свече нет закрытия. Ситуация возможна при небольших значениях Envelope.

Crypto Bot Signal 01 Strategy - Optimized RSI MomentumWelcome to our first Tradingview strategy.
We develop signals which have been specially developed for crypto trading bots. We publish new indicators at regular intervals.
This strategy is based on our "Crypto Bot Signal 01 - Optimized RSI Momentum" indicator, so that you can apply and test this strategy to your charts/pairs.
The basic idea of this script is to compare a low sensitive RSI with a low sensitive smoothed RSI to find the sweet spot to buy. This strategy is relatively robust against false breakouts, even if these can of course never be avoided. These signals occur relatively rare, but you can set an alarm up on different pairs simultaneously. The strategy works best in 5 min chart and in crypto pairs. It wasnt tested in Forex etc. but feel free to test it.
The sell strategy is based on trailing sell and not indicator based cause we believe in the power of long term uptrending crypto, compounding and dont want to sell at a loss in a false breakout. You can set the trailing sell limit to your own preferences or leave it at default value. Our goal is to reduce the average coin holding time to a minimum.
Feel free to adjust the parameters to your preferences:
- A lower value of the RSI and EMA length makes this indicator more sensitive
- A lower threshold value results in better trades but it reduces the amout of possible trades per day
- A higher threshold value results in more trades but the risk of false breakouts gets higher
- Adjusting the trailing sell parameters influences the coin holding time and the results
If there are questions, write them into the comments or contact us directly over the direct message. Happy Trading!

Combo Backtest 123 Reversal & MovROC (KST indicator) This is combo strategies for get a cumulative signal.
First strategy
This System was created from the Book "How I Tripled My Money In The
Futures Market" by Ulf Jensen, Page 183. This is reverse type of strategies.
The strategy buys at market, if close price is higher than the previous close
during 2 days and the meaning of 9-days Stochastic Slow Oscillator is lower than 50.
The strategy sells at market, if close price is lower than the previous close price
during 2 days and the meaning of 9-days Stochastic Fast Oscillator is higher than 50.
Second strategy
This indicator really is the KST indicator presented by Martin Pring.
the KST indicator is a weighted summed rate of change oscillator that
is designed to identify meaningful turns. Various smoothed rate of change
indicators can be combined to form different measurements of cycles.
WARNING:
- For purpose educate only
- This script to change bars colors.
McClellan Oscillator StrategyBuy and sell programs when 5 day EMA goes above and below zero, respectively.
Useful for LEVERAGED ETF trading such as SPXL, TECL, FNGU, etc. Not so much for general portfolio holdings.

Combo Backtest 123 Reversal & Moving Average Envelopes This is combo strategies for get a cumulative signal.
First strategy
This System was created from the Book "How I Tripled My Money In The
Futures Market" by Ulf Jensen, Page 183. This is reverse type of strategies.
The strategy buys at market, if close price is higher than the previous close
during 2 days and the meaning of 9-days Stochastic Slow Oscillator is lower than 50.
The strategy sells at market, if close price is lower than the previous close price
during 2 days and the meaning of 9-days Stochastic Fast Oscillator is higher than 50.
Second strategy
Moving Average Envelopes are percentage-based envelopes set above and
below a moving average. The moving average, which forms the base for
this indicator, can be a simple or exponential moving average. Each
envelope is then set the same percentage above or below the moving average.
This creates parallel bands that follow price action. With a moving average
as the base, Moving Average Envelopes can be used as a trend following indicator.
However, this indicator is not limited to just trend following. The envelopes
can also be used to identify overbought and oversold levels when the trend is
relatively flat.
WARNING:
- For purpose educate only
- This script to change bars colors.
Momentum Strategy (BTC/USDT; 1h) - MACD (with source code)Good morning traders.
It's been a while from my last publication of a strategy and today I want to share with you this small piece of script that showed quite interesting result across bitcoin and other altcoins.
The macd indicator is an indicator built on the difference between a fast moving average and a slow moving average: this difference is generally plottted with a blue line while the orange line is simply a moving average computed on this difference.
Usually this indicator is used in technical analysis for getting signals of buy and sell respectively when the macd crosses above or under its moving average: it means that the distance of the fast moving average (the most responsive one) from the slower one is getting lower than what it-used-to-be in the period considered: this could anticipate a cross of the two moving averages and you want to anticipate this potential trend reversal by opening a long position
Of course the workflow is specularly the same for opening short positions (or closing long positions)
What this strategy does is simply considering the moving average computed on macd and applying a linear regression on it: in this way, even though the signal can be sligthly delayed, you reduce noise plotting a smooth curve.
Then, it simply checks the maximums and the minimums of this curve detecting whenever the changes of the values start to be negative or positive, so it opens a short position (closes long) on the maximum on this curve and it opens a long position (closes short) on the minimum.
Of course, I set an option for using this strategy in a conventional way working on the crosses between macd and its moving average. Alternatively you can use this workflow if you prefer.
In conclusion, you can use a tons of moving averages: I made a function in pine in order to allw you to use any moving average you want for the two moving averages on which the macd is based or for the moving average computed on the macd
PLEASE, BE AWARE THAT THIS TRADING STRATEGY DOES NOT GUARANTEE ANY KIND OF SUCCESS IN ADVANCE. YOU ARE THE ONE AND ONLY RESPONSIBLE OF YOUR OWN DECISIONS, I DON'T TAKE ANY RESPONSIBILITY ASSOCIATED WITH THEM. IF YOU RUN THIS STRATEGY YOU ACCEPT THE POSSIBILITY OF LOOSING MONEY, ALL OF MY PUBBLICATIONS ARE SUPPOSED TO BE JUST FOR EDUCATIONAL PURPOSES.
IT IS AT YOUR OWN RISK WHETHER TO USE IT OR NOT
But if you make money out of this, please consider to buy me a beer 😜
Happy Trading!

Heatmap - Multi-Timeframe Indicators - StrategyHeatmap - Multi-Timeframe Indicators - Strategy
▪ Main features :
- 19 Timeframes: 1m, 3m, 5m, 10m, 15m, 30m, 45m, 1h, 2h, 3h, 4h, 5h, 6h, 8h, 10h, 12h, 1D, 1W, 1M
- 6 indicators per timeframe
- choose specific timeframes for indicators (example - 1 hour)
- or choose specific timeframe ranges (example - 1 hour to 1 month)
The general idea is that the higher timeframe signals are stronger than the lower timeframe ones.
When a trend is starting, it is first visible on the lower timeframes.
The more time passes, the more the trend propagates through higher timeframes.
The default settings are meant to show all the available features. You may fine-tune it to your specific needs.
How to choose the timeframe for the chart : use the lowest of the choosen timeframes for indicators.
If the heatmap doesn't display correctly on your device, you may check the Heatmap Theme 🎨 setting.
It doesn't repaint.
"Repaint" version available though - good to check the past history, but very bad for real-time analysis.
▪ Indicators used for trend detection
1. MACD Cross
2. Stochastic Cross
3. Stochastic Cross and Overbought or Oversold
4. Moving Average
5. Parabolic SAR
6. Heikin Ashi
▪ Find the best Heatmap settings with the Strategy Tester version.
The signals generated by the Heatmap are considered to be valid at the bar open .
The Strategy Tester, however, uses the bar close in its calculations.
Therefore, the results may seem to be worse than they can be.
The Profitability, Profit Factor and other stats should be taken into consideration relatively to other configurations of the same Heatmap.
▪ Using a score system to consider a change in trend valid.
Example: consider the signal valid if 65% or more of all indicators (max 6) among all timeframes (max 19) hint at a change in trend.
The % percent value can be inserted in settings.
When using the default settings or when all timeframes and indicators are activated,
the ratio of 100% downtrend or 100% uptrend may be less occuring. Adjust accordingly.
The signals across timeframes and indicators are aggregated to show simple entry and exit signals.
▪ Combined Alerts, to be set to fire once per bar open :
0 - 📈 Long! - Heatmap - Multi-TFI
0 - 📈 Short! - Heatmap - Multi-TFI
0 - 📈 Long Exit! - Heatmap - Multi-TFI
0 - 📈 Short Exit! - Heatmap - Multi-TFI
1 *** BUY or SELL (single alert) ***
1 *** Entries or Exits (single alert) ***
▪ Note : The initial load may be slow. If something doesn't seem to work, you can try the following:
- wait more time for it to load
- hide & show or remove & add back to chart
- don't add the indicator to chart multiple times in a short amount of time, as you may be rate limited
▪ Related Studies :
- Heatmap - Multi-Timeframe Indicators - Alerts
- Risk Management System (Stop Loss, Take Profit, Trailing Stop Loss, Trailing Take Profit) - it can be connected to Heatmap - Multi-Timeframe Indicators - Alerts
▪ Layout example:
