VWAP Tension Bands + Osc Sigma Gap [MAXmks]Hello Traders,
This indicator started as an accident. I was building a different tool — a multi-metric dashboard — and added VWAP deviation as one of the components. I expected it to help catch falling knives. It didn't.
But I noticed something else. During cooling-off periods — when volatility fades and price just sits there, not really going anywhere — VWAP deviation on lower timeframes would start climbing quietly. And more often than not, a pullback followed. Sometimes a liquidity sweep first, then a pullback. I watched this pattern for months before deciding to build a dedicated tool around it, adding oscillator confirmation to filter the noise.
This is that tool.
The core idea
Markets act like a rubber band around VWAP — the further price stretches, the higher the tension. But raw deviation isn't enough. The real question: is momentum confirming the stretch, or lagging behind?
The σ-Gap captures when these two disagree — price pushed hard, but internals haven't caught up. That's where mean-reversion setups tend to appear.
The indicator tracks VWAP deviation across 2m / 5m / 15m simultaneously and compares it against a composite of momentum oscillators (Williams %R, CVD-based metrics). Signals require multi-timeframe consensus — no single timeframe can trigger alone.
Adaptive thresholds
What counts as "extreme" isn't fixed. Distance is measured in standard deviations (σ) , not pips or percentages — so the indicator adapts to volatility automatically. Thresholds scale with regime and historical distribution, adjusting to current market conditions in real time.
Two modes
Standard — adaptive thresholds, more signals. Good for active sessions and exploration.
High Precision — adds divergence confirmation from multiple oscillators (MFI, Delta RSI, CVD Z-Score). Fewer signals, higher selectivity.
Extreme Tension
When σ-Gap exceeds 1.6× the threshold, the indicator can fire without full confirmation. Rare, but these are the "overstretched" moments worth watching.
Filters (so you don't trade ghosts)
RVOL filter blocks signals during low activity. Session close filter avoids entries near VWAP reset. 24h volume filter skips illiquid instruments. Cooldown prevents signal clustering in the same direction.
Best use case
Built for short-term mean-reversion — quick snapback plays on 5m–15m charts where price overextends and reverts within a few candles. The engine is optimized for this rhythm, not for trend-following or swings.
On-chart
Tension Bands show dynamic threshold zones around VWAP. Signals are non-repainting and confirmed on bar close. Compact HUD displays all metrics, filter states, and signal status in real time.
Alerts
Pre-signal alerts when conditions start forming. Confirmed signal alerts with full breakdown: VWAP deviation values, σ-Gap readings, divergences detected, current mode.
Volume matters
This is a VWAP-based indicator. No volume data = no signal. If your instrument shows "No Volume" in the dashboard, switch to a data feed that provides it (crypto spot, futures, stocks with real volume).
A note on expectations
I use this logic in my own research and it has shown useful results for me in my backtesting scenarios. But this is an indicator for analysis , not a magic button. Your execution, fees, slippage, and market regime all matter. Treat signals as context, not commands. DYOR.
Feedback welcome.
For educational and analysis purposes only. Not financial advice.
Mtfanalysis

Multi-Timeframe Order BlocksDesigned to identify and visualize key supply and demand zones based on order block theory across multiple timeframes. The indicator detects order blocks by analyzing sequential candle patterns and price movement thresholds to highlight potential reversal or continuation zones where institutional buying or selling activity may have occurred.
The indicator works by scanning for clusters of consecutive bullish or bearish candles followed by a significant price move, which signals the formation of an order block. It then plots these zones as colored boxes on the chart—green for demand (bullish order blocks) and red for supply (bearish order blocks). The zones can be based on candle bodies or wicks, depending on user preference, and the indicator supports multi-timeframe analysis by allowing optional higher timeframe inputs.
How It Works:
Sequential Candle Detection: The indicator looks for a specified number of consecutive bullish or bearish candles (configurable by the user) to identify potential order blocks.
Price Movement Threshold: It checks if the price movement after the order block formation exceeds a user-defined percentage threshold, ensuring only significant zones are marked.
Zone Plotting: Once an order block is confirmed, the indicator draws a supply or demand zone as a box on the chart, using either candle bodies or wicks for zone boundaries.
Multi-Timeframe Support: Users can optionally specify higher timeframes to incorporate broader market context, enhancing the reliability of the zones.
Zone Management: The indicator limits the number of zones displayed to avoid clutter, automatically removing the oldest zones when the maximum count is exceeded.
How to Interpret:
Demand Zones (Green Boxes): These represent areas where buying pressure was strong enough to create a bullish order block. Price often finds support here, making these zones potential entry points for long trades or areas to watch for price bounces.
Supply Zones (Red Boxes): These indicate areas of strong selling pressure forming bearish order blocks. Price may face resistance in these zones, which can be used as potential exit points for longs or entry points for shorts.
Multi-Timeframe Confirmation: Zones identified on higher timeframes tend to be stronger and more reliable. Use the optional higher timeframe inputs to align your trades with broader market trends.
Use with Other Indicators: Combine order block zones with volume, momentum, or trend indicators to improve trade confirmation and risk management.
Zone Breaks: A decisive break and close beyond a supply or demand zone may signal a shift in market sentiment and potential trend continuation or reversal.
Disclaimer
This indicator is provided for educational and informational purposes only and does not constitute financial advice. Trading involves significant risk, and it is possible to lose more than your initial investment. Users should conduct their own research and consider their financial situation carefully before making any trading decisions. The developer and publisher of this indicator are not responsible for any trading losses or damages incurred. Always use proper risk management and consult with a licensed financial advisor if needed.

Linear Regression Channel with Multi Sigma and Multi Time FrameThis indicator applies multi-sigma linear regression across multiple institutional time horizons to quantify the line of best fit in equities and index markets. By combining multi-timeframe presets with statistically derived deviation bands, it highlights trend structure, volatility expansion, and regime transitions with clarity.
Features
Auto-Multi-Timeframe presets map directly to institutional trend horizons (daily, weekly, monthly) for accurate regime detection.
Multi-Sigma bands (+/-1, +/-2, +/-3) reveal volatility structure, trend strength, and statistical extremes.
The regression line uses a true least-squares calculation, recalculated each bar for precise trend alignment.
Deviation mode allows switching between standard deviation and max deviation to support different volatility models.
A linked PDF on GitHub provides full documentation, derivations, and institutional use-case examples.
More Information Can Be Found Here:
github.com

Relative Strength Index (RSI) w/ Multi Time Frame w/ DivergencesThis indicator is an advanced evolution of the classic Relative Strength Index (RSI), designed to provide deeper market context by combining Momentum, Multi-Timeframe (MTF) analysis, and Divergences into a single, clean visual tool.
Unlike standard indicators, RSI MTF Pro v2 allows you to configure the Main RSI and the Background Trend Zone independently, giving you full control over your strategy (e.g., watching a 15m RSI while monitoring the 4H trend).
Key Features:
🚀 Dual MTF Engine: Completely independent settings for the Main RSI Line and the Background Zone. You can choose different Timeframes, Lengths, and Levels for each.
heatmap Style Background: The indicator background changes color (Red/Green) based on the MTF RSI trend, helping you filter out bad trades and stick to the dominant trend.
🎨 Smart Gradient Fills: To keep your chart clean, the gradient colors (Red/Green fills) only appear when the RSI breaches the Overbought or Oversold levels.
🎯 Divergence Detector: Automatically spots and marks Regular Bullish and Bearish divergences with pivot-based logic.
How to Use:
Trend Confirmation: Use the Background Color to determine the higher timeframe direction (e.g., Red Background = Uptrend).
Entry Signals: Look for RSI signals that align with the background color (e.g., RSI Oversold/Green Gradient + Green Background).
Reversals: Use the built-in Divergence circles to spot potential trend reversals.
Settings:
Main RSI: Customizable Timeframe, Length, OB/OS Levels.
MTF Background: Independent Timeframe, Length, and Zone thresholds (e.g., >60 Red, <40 Green).
Divergences: Toggle On/Off and adjust Pivot lookback periods.
Disclaimer: This tool is for informational purposes only and does not constitute financial advice.

Money Flow Index (MFI) w/ Multi Time Frame DivergencesBack color MTF
Money Flow Index (MFI) w/ Multi Time Frame Divergences

VDUB Bands - MTF WMA+ATR Volatility Lanes (6 Alerts)VDUB Bands draws volatility-scaled “trend lanes” around a Weighted Moving Average (WMA) using ATR (or a WMA of True Range). It can display up to four tiers (L1–L4), with higher tiers sourced from higher timeframes to show local structure → higher-timeframe structure on a single chart.
────────────────────────────────────────
1. What it does (plain English)
────────────────────────────────────────
Think of each tier as a lane system around the trend:
• Inner rails = “normal volatility lane” around the WMA
• Outer rails = “extension / extreme zone” for that tier
• Higher tiers (L3/L4) show bigger structure
• Lower tiers (L1/L2) show active lane behavior
Typical interpretation:
• Price inside inner rails → normal variance around the trend lane
• Between inner and outer → stretched, but not extreme
• Outside outer rails → extended vs that tier’s volatility band
────────────────────────────────────────
2) Why it’s useful (and why it’s not a mashup)
────────────────────────────────────────
This is not a bundle of unrelated indicators. Everything serves one cohesive purpose:
• Visualize trend + volatility lanes across multiple time horizons
• Keep rails consistent and readable (levels, fills, outlines)
• Optional multi-timeframe aggregation for structure context
• A compact 6-alert set to catch key transitions without alert spam
────────────────────────────────────────
3) What you see on the chart
────────────────────────────────────────
For each level (L1–L4), you can show:
• Upper/Lower Inner rails
• Upper/Lower Outer rails
• Optional center fill (between outer rails) = operating range
• Optional MA line per tier (off by default to reduce clutter)
• Base WMA line (L1 MA) if enabled
Suggested workflow:
• Start with L1 + L2 only
• Add L3/L4 once you like the structure view
• Use Dynamic Opacity if the chart feels crowded
────────────────────────────────────────
4) How it works (transparent formula)
────────────────────────────────────────
For each tier:
• MA = WMA(source, baseLen × levelMultiplier)
• ATR_like = Wilder ATR (default)
OR WMA(TrueRange, atrLen × levelMultiplier)
Inner rails:
• upperInner = MA + ATR_like × innerMult
• lowerInner = MA - ATR_like × innerMult
Outer rails:
• upperOuter = MA + ATR_like × outerMult
• lowerOuter = MA - ATR_like × outerMult
Tier behavior:
• L1 uses the chart timeframe
• L2–L4 can use user-selected HTFs (defaults: 4H / D / W)
or optional auto-selection
────────────────────────────────────────
5) Multi-timeframe behavior + interpolation
────────────────────────────────────────
• L2–L4 use request.security() with lookahead OFF (no future data).
• HTF bands naturally “step” when the HTF candle confirms.
• Interpolate HTF Bands (optional): visually blends from the prior confirmed HTF value to the current confirmed HTF value to reduce stepping. This is display smoothing, not prediction.
Repaint note:
• If Live Interp (Repaints) is enabled, the HTF lines can update intrabar and may repaint. Keep it OFF for strict non-repainting behavior.
────────────────────────────────────────
6) Auto-select L2/L3/L4 (optional)
────────────────────────────────────────
Two modes:
A) Ladder (deterministic)
• Picks “bigger” timeframes relative to the chart (simple and fast).
B) Score (data-driven)
• Tests candidate timeframes and scores them using:
• Coverage: % of closes inside the OUTER band over Score Lookback
• Width: average outer-band width as a fraction of MA
• Targets: Target Coverage + Target Width
• Weights: Coverage Weight + Width Weight
Performance notes:
• Score mode is heavier (many candidates).
• “Lock auto-select after first pick” is recommended to reduce load and avoid platform limits.
────────────────────────────────────────
7) Alerts (6 total, aggregated across L1–L4)
────────────────────────────────────────
Alerts trigger if ANY tier meets the condition:
• Cross ABOVE an OUTER band
• Cross BELOW an OUTER band
• Cross ABOVE an INNER band
• Cross BELOW an INNER band
• Price is OUTSIDE ABOVE an OUTER band
• Price is OUTSIDE BELOW an OUTER band
These are intentionally aggregated to keep the alert count small while catching meaningful transitions.
────────────────────────────────────────
8) Limitations & transparency
────────────────────────────────────────
• Indicator only (not a strategy). No performance claims.
• MTF values update when the higher timeframe candle confirms.
• Interpolation is visual smoothing; it does not forecast.
• Non-standard chart types (Heikin Ashi/Renko/etc) may behave differently from standard candles.
• If you enable repainting options, signals/levels may change intrabar.
────────────────────────────────────────
9) Credits/reuse disclosure
────────────────────────────────────────
• Conceptual inspiration: VDUB and the community “VDUB_BINARY_PRO_3_V2” idea of WMA ± TR/ATR × multipliers.
• This version is a reimplementation + extension, adding:
o Multi-tier architecture (L1–L4)
o Higher-timeframe sourcing + optional interpolation
o Optional scoring-based timeframe selection
o Dynamic opacity + streamlined plotting
o Aggregated 6-alert set
No code was copied directly from the older script; this is a rewritten implementation with additional features and different structure.
www.tradingview.com

EDUVEST QQE Signal v3.0 - Multi-Timeframe Scoring SystemEDUVEST QQE Signal v3.0 - Multi-Timeframe Scoring System
━━━━━━━━━━━━━━━━━━━━━━━━━━━━━━━━━━━━━━━━━━━━━━━━
█ ORIGINALITY
This indicator combines QQE (Quantitative Qualitative Estimation) with HMA (Hull Moving Average) and introduces a unique AI-based scoring system that rates signal quality from 0-100. Unlike traditional QQE indicators that show simple buy/sell signals, this version categorizes signals into four strength levels: BIG CHANCE, SUPER, POWER, and STRONG.
━━━━━━━━━━━━━━━━━━━━━━━━━━━━━━━━━━━━━━━━━━━━━━━━
█ WHAT IT DOES
- Generates scored BUY/SELL signals with quality ratings (60-100 points)
- Categorizes signals into 4 strength levels for easy decision making
- Supports Multi-Timeframe (MTF) analysis
- Auto-detects asset type and applies optimized QQE factors
- Provides customizable alerts based on score thresholds
Signal Hierarchy:
- 💰 BIG CHANCE (90-100): Highest probability setups
- ⚡ SUPER (80-89): Very strong signals
- 🚀 POWER (70-79): Strong signals with HMA confluence
- 💪 STRONG (60-69): Standard quality signals
━━━━━━━━━━━━━━━━━━━━━━━━━━━━━━━━━━━━━━━━━━━━━━━━
█ HOW IT WORKS
【QQE Calculation】
QQE is based on a smoothed RSI with dynamic bands:
1. Calculate RSI with specified period (default: 14)
2. Apply EMA smoothing to RSI (Smoothing Factor, default: 5)
3. Calculate ATR of the smoothed RSI
4. Create dynamic bands: RSI ± (ATR × QQE Factor)
The QQE Factor is automatically adjusted per asset:
- Forex (USDJPY, EURUSD): 3.8 - 4.238
- Gold (XAUUSD): 8.0
- Crypto (BTC): 12.0, (ETH): 10.0
- Indices (NASDAQ): 4.238
【HMA Calculation】
Hull Moving Average for trend confirmation:
HMA = WMA(2 × WMA(price, n/2) - WMA(price, n), √n)
【Signal Generation】
- BUY: QQE crosses above its band (QQExlong == 1)
- SELL: QQE crosses below its band (QQExshort == 1)
【AI Scoring System】
The score is calculated from multiple factors:
Signal Base (0-35 points):
- QQE + HMA confluence: +35
- QQE or HMA alone: +25
QQE Strength (10-25 points):
- RSI distance from 50 (momentum strength)
- >30 distance: +25, >20: +20, >10: +15, else: +10
Volatility Score (-10 to +15 points):
- ATR ratio 1.1-2.0: +15 (optimal volatility)
- ATR ratio <0.8: -10 (low volatility warning)
Volume Confirmation (-5 to +15 points):
- Volume > 120% of average: +15
- Volume < 80% of average: -5
Base Points: +15
Final Score = Clamped(0, 100, sum of all factors)
━━━━━━━━━━━━━━━━━━━━━━━━━━━━━━━━━━━━━━━━━━━━━━━━
█ HOW TO USE
【Recommended Settings】
- Timeframe: 5M, 15M, 1H, 4H
- Best on: Forex, Gold, NASDAQ, BTC/ETH
- Minimum Score: 60 (adjustable)
【Reading Signals】
- BIG CHANCE (Gold label, 90+): Highest conviction - consider larger position
- SUPER (Yellow label, 80-89): Very strong - standard position
- POWER (Cyan/Magenta label, 70-79): Strong with trend confirmation
- STRONG (Green/Red label, 60-69): Valid but use additional confirmation
【MTF Feature】
Enable MTF to analyze signals from a higher timeframe while viewing lower timeframe charts. The indicator auto-selects 5-minute as the analysis timeframe, or you can set it manually.
【Alert Setup】
1. Enable alerts in settings
2. Set minimum score threshold (default: 60)
3. Create alert with "Any alert() function call"
【Important Notes】
- Signals are confirmed at bar close (no repainting)
- Higher scores = higher probability, not guaranteed profits
- Always use proper risk management
- Consider market context and support/resistance levels
━━━━━━━━━━━━━━━━━━━━━━━━━━━━━━━━━━━━━━━━━━━━━━━━
█ SETTINGS
⏱️ MTF Settings
- MTF Use: Enable multi-timeframe analysis
- Manual Timeframe: Override auto-detection
- Show Panel: Display info panel (default: OFF)
🎨 Design
- Neon Colors: Vibrant color scheme
- Show HMA Line: Display HMA on chart
- Minimum Score: Filter weak signals
- Label Transparency: Adjust label opacity
- Large Labels: Mobile-friendly sizing
🔧 QQE Settings
- RSI Period: RSI calculation period
- Smoothing: EMA smoothing factor
- AI Score: Enable scoring system
🔔 Alerts
- Enable Alerts: Turn on/off notifications
- Minimum Score: Alert threshold
━━━━━━━━━━━━━━━━━━━━━━━━━━━━━━━━━━━━━━━━━━━━━━━━
█ CREDITS
QQE concept originally developed by John Ehlers.
HMA (Hull Moving Average) by Alan Hull.
Enhanced with scoring system and MTF support by EduVest.
License: Mozilla Public License 2.0


HTF Balanced Price RangeThis script is based off of TradeForOpp's BPR indicator, but I adapted it to work on higher timeframes

BBands + Overbought/Oversold MarkersAdvanced Bollinger Bands indicator with overbought/oversold signals, automatic squeeze detection, and multi-timeframe (MTF) capabilities.
Retains all functions of the original Bollinger Bands indicator from TradingView with a few added features:
Overbought/Oversold Markers: Visual signals when price opens and closes outside the bands
🔴 Red Highlight & Arrow → Price opens & closes above the upper BB (potential overbought/excess momentum).
🟢 Green Highlight & Arrow → Price opens & closes below the lower BB (potential oversold/reversal).
Squeeze Detection: Automatically highlights when bandwidth reaches its lowest point (narrowest BB width) in the lookback period, signalling potential breakout zones
Multi-Timeframe Bands: Display Bollinger Bands from any timeframe on your current chart (e.g., weekly bands on a daily chart), including markers and squeeze zones
Dual Rendering MTF Modes: Choose between traditional plots (unlimited history) or smooth line drawing (~125-165 MTF bars of history)
Built-in Alerts: Set alerts for overbought conditions, oversold conditions, squeeze detection, or any combination
Fully Customizable: Adjust MA type (SMA/EMA/RMA/WMA/VWMA), standard deviation multiplier, colors, and marker styles
Perfect for: Swing traders, MTF analysis, volatility-based entries, and identifying consolidation/expansion cycles.

Cave Diving 3 Lines System
🤿 Cave Diving Dashboard - A Deep Dive into Market Structure
## The Cave Diving Analogy
Imagine you're a cave diver exploring underwater caverns. As you descend deeper, you encounter different layers of the cave system:
- **The Surface (Internal Levels)** - Where you currently are, constantly shifting with each breath
- **The First Chamber (De Novo Levels)** - Your last known safe position, recently established
- **Deep Caverns (External Levels)** - Ancient, untouched chambers deeper in the system
Just as a cave diver must constantly monitor their position relative to these reference points, traders must track price action against key structural levels.
---
## 🎯 Understanding the Three-Tiered System
### 📍 **INTERNAL LEVELS** (Current 15m Candle)
*Your real-time position in the market*
**Internal High** 🟡 - The highest point reached in the current unfinished 15-minute candle
**Internal Low** 🟢 - The lowest point reached in the current unfinished 15-minute candle
**Think of these as:**
- Your current depth while actively diving
- They update continuously as price moves
- Status shows "Updating" when actively changing, "Intact" when stable
- These are NOT trade levels—they're awareness zones
**Key Insight:** When Internal Low drops below De Novo Low, you're in **Situation A** (bearish pressure building)—the indicator highlights this with red coloring.
---
### 🎯 **DE NOVO LEVELS** (Previous Closed 15m Candle)
*Your most recent confirmed safe zone*
**De Novo High** 🔵 - The high of the last completed 15-minute candle
**De Novo Low** 🟣 - The low of the last completed 15-minute candle
**Etymology:** "De Novo" = Latin for "from new" or "anew"—these are freshly established reference points
**Think of these as:**
- The last solid ground you stood on
- Your most recent confirmed position
- The bridge between where you are (Internal) and where you've been (External)
**Status Tracking:**
- **⬆️ Upgrade** - Level moved favorably (Higher high for resistance, Higher low for support)
- **⬇️ Downgrade** - Level moved unfavorably (Lower high, Lower low)
- **= Same** - No structural change from previous candle
**Trading Significance:**
- Primary reference points for intraday structure
- Breaking De Novo levels often signals directional commitment
- Can merge with External Level 1 when they align (shown as "DN🟰Ext1")
---
### ⛽🤿 **EXTERNAL LEVELS** (Unmitigated Historical 15m Levels)
*Deep liquidity pools waiting to be discovered*
**External High 1 & 2** 🟢🔵 - The two most recent unmitigated 15m highs
**External Low 1 & 2** 🟠🌸 - The two most recent unmitigated 15m lows
**Think of these as:**
- Untouched chambers in the cave system
- Liquidity pools that smart money is targeting
- Levels that "remember" and attract price
**What Makes a Level "Unmitigated"?**
- **Highs**: Price has NOT yet traded through them (broken above)
- **Lows**: Price has NOT yet swept them (broken below)
- Once touched, they're "mitigated" and removed from tracking
- The indicator automatically maintains the two most recent unmitigated levels
**Why "External"?**
They exist outside your current candle structure—historical reference points that institutions use for:
- Stop loss placement
- Profit taking targets
- Liquidity hunting zones
---
## 🎨 Color Coding System
### HIGHS (Resistance/Targets) - Cool Colors
- 🔵 **Ext High 2** - Light Blue (Distant target)
- 🟢 **Ext High 1** - Lime Green (Primary target)
- 🔵 **De Novo High** - Cyan (Recent resistance)
- 🟡 **Internal High** - Lemon Yellow (Current ceiling)
### LOWS (Support/Stops) - Warm Colors
- 🟢 **Internal Low** - Lime (Current floor)
- 🟣 **De Novo Low** - Purple (Recent support)
- 🟠 **Ext Low 1** - Orange-Red (Primary stop zone)
- 🌸 **Ext Low 2** - Pink (Distant support)
---
## 📊 Dashboard Breakdown
### The Table Shows:
1. **Level** - Which level you're tracking
2. **Price** - Exact price of the level
3. **Pts** - Distance from current price (+ above, - below)
4. **Status** - Current state or role of the level
### Special Features:
- **⏰ Countdown Timer** - Shows time remaining until next 15m candle close (next De Novo update)
- **⚠️ Proximity Alerts** - Bottom row warns when within threshold distance of key levels (default: 25 points, adjustable)
---
## 🎯 Trading Applications
### **For Buyers (Going Long):**
- **Entry Zone**: Between De Novo Low and Ext Low 1
- **Stops**: Below Ext Low 1 (or Ext Low 2 for wider stops)
- **Targets**: De Novo High → Ext High 1 → Ext High 2
- **Confirmation**: Internal Low holds above De Novo Low
### **For Sellers (Going Short):**
- **Entry Zone**: Between De Novo High and Ext High 1
- **Stops**: Above Ext High 1 (or Ext High 2 for wider stops)
- **Targets**: De Novo Low → Ext Low 1 → Ext Low 2
- **Warning**: Watch for Situation A (Internal Low < De Novo Low)
### **Risk Management:**
- **DN🟰Ext1** status means De Novo = External 1 (tighter range, use caution)
- Proximity alerts help you avoid chasing price into resistance/support
- "Updating" status on Internal levels = active volatility
- "Upgrade/Downgrade" signals = structural shift in progress
---
## ⚙️ Customization Options
### Lookback Period
- Default: 500 candles (searches 125 hours of 15m data)
- Increase for more historical External levels
- Decrease for focus on recent structure
### Proximity Threshold
- Default: 25 points
- Set based on your instrument's average range
- Lower = tighter alerts (for scalping)
- Higher = strategic warnings (for swing trading)
### Visual Customization
- Line thickness (1-5)
- Line style (Solid/Dashed/Dotted)
- All colors fully customizable
- Show/hide lines independently
---
## 🧭 The Cave Diving Mindset
**Never dive deeper than you can safely return from.**
In trading terms:
- Know your Internal position (real-time awareness)
- Respect your De Novo levels (recent structure)
- Hunt for External liquidity (where the targets are)
- Always have an exit plan (stops below Ext Lows, above Ext Highs)
The market, like a cave, has structure. This indicator illuminates that structure across three timeframes of reference, helping you navigate with precision rather than guessing in the dark.
---
## 🎓 Key Takeaways
1. **Internal** = Real-time, unfinished, awareness only
2. **De Novo** = Just confirmed, primary reference, updates every 15m
3. **External** = Historical, unmitigated, high-probability targets/stops
4. **Upgrades/Downgrades** = Trend signals
5. **DN🟰Ext1** = Structural alignment (tighter range)
6. **Situation A** = Bearish warning (Internal < De Novo Low)
---
## 📝 Credits
*"In cave diving, you plan your dive and dive your plan. In trading, you plan your levels and trade your levels."*
**Indicator:** Cave Diving Dashboard - Part 1: Price Levels
**Timeframe:** Optimized for 15-minute structure on any chart timeframe
**Philosophy:** Structure first, price second. Know where you are, where you've been, and where the liquidity waits.
---
Happy Diving! 🤿📈

Advanced custom multi MA signals (EMA/SMA/VWMA/VWAP) Features of Multi Moving Averages
The biggest enemy in trading is "Noise." If you get swayed by minute fluctuations on the chart, you end up missing the forest for the trees.
This indicator (Advanced Custom Multi MA Signals) is not just a simple line. By combining the three core elements of Price, Time, and Volume, it acts as a navigation system that visualizes the market's "true trend." In particular, the ability to analyze 5 moving averages simultaneously across various timeframes is akin to viewing a 3D map of the battlefield.
Understanding Core Concepts
This indicator supports 4 types of moving averages. It is crucial to clearly understand the nature of each tool.
SMA (Simple Moving Average): The most basic average value. Since it produces fewer whipsaws (false signals), it is used as a baseline to judge the "long-term trend."
EMA (Exponential Moving Average): Places more weight on recent prices. It reacts sensitively to market changes, making it advantageous for identifying "entry points."
VWMA (Volume Weighted Moving Average): Incorporates "volume" into the price calculation. It acts as a "false signal filter," weeding out price moves that aren't backed by trading volume.
VWAP (Volume Weighted Average Price): The benchmark price used by institutional investors for daily trading. It is calculated based on the session, regardless of the period settings. It is considered the "lifeline" of day trading.
Indicator Settings Guide
Open the settings window and tune it to fit your trading style.
MA 01 ~ 05 (Moving Average Settings)
MA Type: Select according to your purpose. (Generally, EMA is recommended for short-term analysis, SMA/VWMA for long-term).
Length: Enter the period you wish to analyze (e.g., 20, 60, 120, 200).
Timeframe: This is the core feature. It allows you to overlay moving averages from a higher timeframe (e.g., 4-hour, Daily) onto the chart you are currently viewing (e.g., 15-minute).
Signal Option (Trading Signals)
Golden Cross (GC) / Death Cross (DC): Captures the moment the short-term line breaks through the long-term line. You can run up to 3 strategies simultaneously.
Ribbon Gradient (Trend Visualization)
Represents the gap between two moving averages with color. As the color deepens and the width expands, it indicates a powerful trend; if the width narrows, it suggests a high probability of a trend reversal.
5 Usage Strategies
The highlight of this indicator is the cross strategy utilizing the "Multi-Timeframe (MTF)" feature. Familiarize yourself with the 5 example strategies below and set up your own strategy based on your expertise.
💡 Tip 1. Do not go against the "Major Trend" (The Authority of the Weekly Candle)
Settings: Set MA5 to .
Interpretation: The Weekly 50 line is the "major trend line" managed by institutions and market makers. If the current price is above this line, maintain only a "Buy (Long)" bias; if below, maintain only a "Sell (Short)" bias. Adhering to this rule alone can help you avoid massive losses.
💡 Tip 2. Highly Reliable "Swing Signal" (Daily Golden Cross)
Settings: In Signal 1, configure the Short MA to and the Long MA to .
Interpretation: A Golden Cross where the 4-Hour 50 EMA breaks above the Daily 50 EMA often signifies a major "trend reversal" rather than a temporary rebound. This provides an ideal entry signal for office workers or swing traders who need high reliability.
💡 Tip 3. 4-Hour Candle as the Standard for "Precision Entry"
Situation: When the Daily trend is rising (Bullish alignment).
Strategy: While watching the 15-minute or 1-hour chart, set the indicator's Signal 2 to the cross of and .
Interpretation: When the Daily chart is in an uptrend, a Golden Cross occurring on the 4-Hour chart marks "the point where a correction (pullback) ends and the rise resumes." This is the entry point with the best risk-to-reward ratio.
💡 Tip 4. Filtering Out "Fake Signals" (The Secret of Volume)
Strategy: When creating a cross signal, try using VWMA (Volume Weighted) for the Long MA, even if you use EMA for the Short MA.
Reason: A Golden Cross caused simply by a rise in price can be a trap. However, if it breaks through the heavy VWMA line accompanied by volume, it is strong evidence that "genuine liquidity" has entered.
💡 Tip 5. Remember the "Hierarchy" (Higher Timeframe Priority Rule)
Principle: If a Golden Cross (Buy Signal) appears on the 4-Hour chart, but the Daily chart is in a Death Cross (Sell Signal) state, do not enter.
Interpretation: A signal from a lower timeframe cannot overcome the power of a higher timeframe. The professional approach is to trade with significant volume only when signals align (Sync) in the order of Weekly > Daily > 4-Hour. Keep this indicator's dashboard feature on and always check the status of higher timeframes.
Signal Generation Principle (Operating Mechanism)
Signals are generated when the set short-term moving average and long-term moving average cross each other.
📈 1. Golden Cross (BUY = Buy Signal)
Situation: The moment the short-term MA crosses upward from below the long-term MA.
Principle: It implies that recent buying pressure has broken through the resistance level accumulated over a long period.
📉 2. Death Cross (SELL = Sell Signal)
Situation: The moment the short-term MA crosses downward from above the long-term MA.
Principle: It implies that recent selling pressure has collapsed the long-term support line.
※ If the candles are not displaying correctly or are flickering, please set the indicator's 'Visual order' to 'Bring to front' as shown in the image below.
Investment Caution and Disclaimer
Before using this indicator for actual trading, please strictly read the contents below.
① Auxiliary indicators are a "Compass," not a "Book of Prophecy."
This indicator is merely a tool that mathematically calculates and visualizes past price data. A "magic indicator" that predicts future price fluctuations 100% accurately or guarantees profit does not exist. The signals provided are for reference only and must never be the sole basis for entry/exit decisions.
② The responsibility for all investments lies with "Yourself."
Financial investment (Cryptocurrencies, Stocks, Futures, etc.) involves high volatility and is a risky activity that can result in the loss of some or all of the principal. The final responsibility for all trading results (profits and losses) incurred by utilizing this indicator lies entirely with the investor. The distributor and developer accept no legal responsibility for investment results under any circumstances.
③ Past data does not guarantee the future.
Even a Golden Cross that fit perfectly in backtesting or past charts may operate differently in tomorrow's market situation (News, Macroeconomics, Unexpected Variables, etc.). Do not rely solely on technical analysis; you must conduct fundamental analysis and risk management in parallel.
④ Risk management is the top priority.
No matter how promising a signal appears, "all-in trading" (investing all assets in a single trade) is a shortcut to bankruptcy. More important than the indicator itself is adhering to the principles of strict scaling in (split buying) and Stop-Loss.

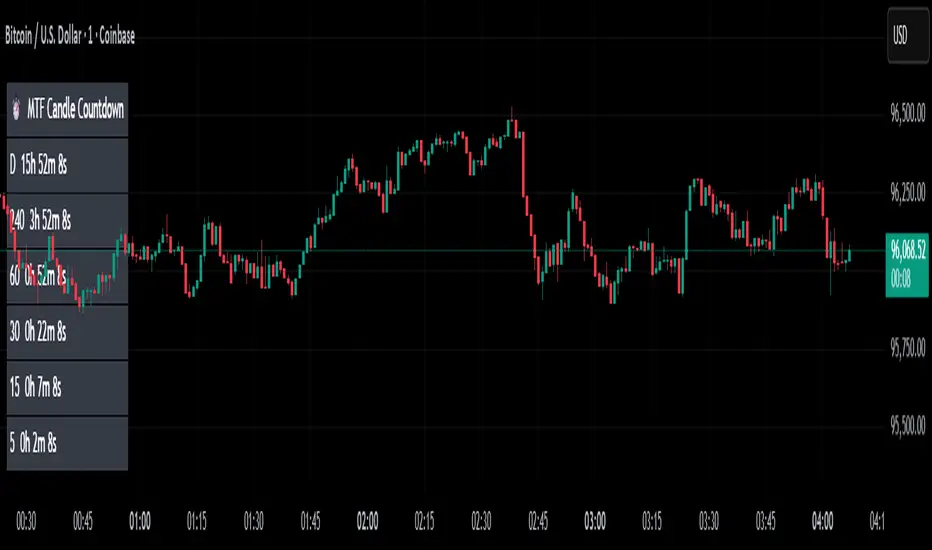
MTF Candle Countdown — HUD V1 (By Price-Action-Art)
MTF Candle Countdown — HUD V1 (By Price-Action-Art)
A clean, lightweight HUD that shows you exactly how much time is left in multiple higher-timeframe candles — all in one place.
This tool is designed for traders who rely on multi-timeframe precision.
Instead of constantly switching charts or checking timers, the HUD gives you a real-time countdown for up to six timeframes (Daily, 4H, 1H, 30m, 15m, 5m by default).
You can fully customize the timeframes, text size, and HUD position on your chart.
Perfect for:
Intraday and scalping timing
Swing traders waiting for HTF candle closes
ICT / SMC structure-based traders
Anyone who needs exact candle close timing without distractions
Features:
Real-time multi-timeframe candle countdown
Fully adjustable HUD placement (all corners)
Customizable timeframes and text size
Clean, minimal, and non-intrusive design
Updates only on the last bar for performance efficiency
Optional border for a sharper HUD look
Whether you’re waiting for a Daily close to confirm structure or timing your entries around 5m/15m candles, this HUD keeps everything visible and precise at a glance.
If you find this tool helpful, feel free to like, comment, and follow — it motivates me to keep releasing more tools for the community.
Fair Value Gaps by DGTFair Value Gaps
A refined, multi-timeframe Fair Value Gap (FVG) detection tool that brings institutional imbalance zones to life directly on your chart.
Designed for precision, it visualizes how price delivers into inefficiencies across chart, higher, and lower (intrabar) timeframes — offering a fluid, structural view of liquidity displacement and market flow.
The script continuously tracks unfilled, partially repaired, and fully resolved imbalances, revealing where liquidity inefficiencies concentrate and where price may seek rebalancing.
Overlapping zones naturally expose institutional footprints, potential liquidity targets, and key re-pricing regions within the broader market structure.
KEY FEATURES
⯌ Multi-Timeframe Detection
Detect and display FVGs from the current chart, higher timeframes (HTF), or lower timeframes (LTF)
⯌ Smart Fill Tracking
Automatic real-time monitoring of each FVG’s fill progress with live percentage updates
⯌ Custom Fill Logic
Choose your preferred definition of when a gap is considered filled: Any Touch
Midpoint Reached
Wick Sweep
Body Beyond
⯌ Dynamic Labels & Tooltips
Labels can be toggled on/off. Even when hidden, detailed tooltips remain available by hovering over the FVG midpoint.
⯌ Adaptive Lower-Timeframe Mode
When set to “Auto,” the script intelligently selects the optimal lower timeframe based on the chart resolution.
DISCLAIMER
This script is intended for informational and educational purposes only. It does not constitute financial, investment, or trading advice. All trading decisions made based on its output are solely the responsibility of the user.

Candle Opens by HAZED🎯 Candle Opens by HAZED - Multi-Timeframe Open Levels Indicator
📊 Overview
This powerful indicator displays multiple timeframe opening prices on your chart, providing crucial reference levels that institutional traders and algorithms frequently monitor. Track up to 7 different timeframe opens simultaneously, from 1-hour to yearly, with advanced visualization features including dynamic coloring, heatmap analysis, and real-time status tracking.
✨ Key Features
📈 Multi-Timeframe Support:
- 1H, 4H, Daily, Weekly, Monthly, Quarterly, and Yearly opens
- Each timeframe can be individually enabled/disabled
- Automatic visibility adjustment based on chart timeframe
🎨 Dynamic Visual System:
- Smart Color Coding: Lines automatically change color based on price position (green above, red below)
- Customizable Styling: Adjust line thickness, transparency, and colors
- Intelligent Line Positioning: Choose between equal-length or staggered lines for better visibility
- Enhanced Labels: Display timeframe only or include price with colored background
🌈 Advanced Heatmap:
- Background coloring shows overall market sentiment across all timeframes
- Gradient or solid color modes
- Instantly see when multiple timeframes align bullish or bearish
📊 Status Table Dashboard:
- Real-time overview of all active opens
- Shows current price position relative to each open
- Simplified view when all timeframes align
- Customizable position and font style
⚙️ Professional Tools:
- Alert system for new open levels
- Extended hours session support
- Price discovery mode for EOD/intraday discrepancies
- Left/right line extensions for enhanced visibility
💡 Trading Applications
Support & Resistance:
Opening prices act as natural support/resistance levels. Price often reacts at these levels, providing entry/exit opportunities.
Trend Confirmation:
When price is above multiple opens (especially higher timeframes), it confirms bullish momentum. The opposite indicates bearish pressure.
Mean Reversion:
Price tends to revert to significant opens, particularly daily and weekly levels. Use these as targets for counter-trend trades.
Breakout Trading:
Monitor when price breaks above/below clustered opens for potential continuation moves.
Risk Management:
Use opens as logical stop-loss levels or position sizing references based on distance from key opens.
🔧 Indicator Settings
Timeframes Section:
- Toggle each timeframe on/off
- Customize individual colors
Visual Style Section:
- Dynamic Colors: Auto-color based on price position
- Line Thickness: 1-4 pixels
- Transparency: 0-80%
- Extension Length: How far lines extend right
- Label Style: Plain or enhanced with price
Heatmap Section:
- Enable/disable background coloring
- Adjust transparency
- Choose gradient or solid zones
Status Table Section:
- Position on chart
- Font selection
Advanced Section:
- Enable alerts for new opens
- Price discovery mode
- Extended hours inclusion
]📈 Best Practices
1. Timeframe Selection:
- For intraday: Focus on 1H, 4H, and Daily
- For swing trading: Daily, Weekly, Monthly
- For position trading: Monthly, Quarterly, Yearly
2. Color Coding:
- Enable dynamic colors for instant sentiment reading
- Use heatmap for overall market bias
3. Confluence Zones:
- Pay special attention when multiple opens cluster
- These zones often produce stronger reactions
4. Alignment Signals:
- When all timeframes show same color = strong trend
- Mixed colors = potential consolidation or reversal zone
🎯 Pro Tips
- Volume Confirmation: Combine with volume indicators to confirm reactions at open levels
- Multiple Instruments: Compare opens across correlated assets for divergences
- News Events: Opens often act as magnets after major news releases
- Options Trading: Weekly and monthly opens align with options expiry levels
- Algorithmic Levels: Many algorithms use these opens for entries/exits
🔄 Updates in Version 8.3
- Added 1H and 4H timeframe support
- Enhanced dynamic color system
- Implemented heatmap visualization
- Added real-time status table
- Optimized performance for smoother operation
- Improved label styling options
- Better yearly timeframe detection
⚡ Performance Optimizations
This indicator uses advanced Pine Script v6 features for optimal performance:
- Efficient object reuse instead of recreation
- Smart calculation loops
- Minimal repainting
- Optimized for real-time updates
📝 Notes
- Works on all markets (stocks, forex, crypto, futures)
- Best on timeframes lower than the opens you're tracking
- Lines automatically hide when their timeframe is lower than chart timeframe
- Past opens are not displayed (indicator shows current opens only)
🙏 Credits & Support
Created by HAZED | Version 8.3
Optimized for TradingView Pine Script v6
For questions, suggestions, or bug reports, please comment below.
If you find this indicator useful, please consider leaving a like and a follow!
Remember: No indicator is perfect. Always use proper risk management and combine multiple confirmation signals in your trading decisions.

Mutanabby_AI | Fresh Algo V24Mutanabby_AI | Fresh Algo V24: Advanced Multi-Mode Trading System
Overview
The Mutanabby_AI Fresh Algo V24 represents a sophisticated evolution of multi-component trading systems that adapts to various market conditions through advanced operational configurations and enhanced analytical capabilities. This comprehensive indicator provides traders with multiple signal generation approaches, specialized assistant functions, and dynamic risk management tools designed for professional market analysis across diverse trading environments.
Primary Signal Generation Framework
The Fresh Algo V24 operates through two fundamental signal generation approaches that accommodate different market perspectives and trading philosophies. The Trending Signals Mode serves as the primary trend-following mechanism, combining Wave Trend Oscillator analysis with Supertrend directional signals and Squeeze Momentum breakout detection. This mode incorporates ADX filtering that requires values exceeding 20 to ensure sufficient trend strength exists before signal activation, making it particularly effective during sustained directional market movements where momentum persistence creates profitable trading opportunities.
The Contrarian Signals Mode provides an alternative approach targeting reversal opportunities through extreme market condition identification. This mode activates when the Wave Trend Oscillator reaches critical threshold levels, specifically when readings surpass 65 indicating potential bearish reversal conditions or drop below 35 suggesting bullish reversal opportunities. This methodology proves valuable during overextended market phases where mean reversion becomes statistically probable.
Advanced Filtering Mechanisms
The system incorporates multiple sophisticated filtering mechanisms designed to enhance signal quality and reduce false positive occurrences. The High Volume Filter requires volume expansion confirmation before signal activation, utilizing exponential moving average calculations to ensure institutional participation accompanies price movements. This filter substantially improves signal reliability by eliminating low-conviction breakouts that lack adequate volume support from professional market participants.
The Strong Filter provides additional trend confirmation through 200-period exponential moving average analysis. Long position signals require price action above this benchmark level, while short position signals necessitate price action below it. This ensures strategic alignment with longer-term trend direction and reduces the probability of trading against major market movements that could invalidate shorter-term signals.
Cloud Filter Configuration System
The Fresh Algo V24 offers four distinct cloud filter configurations, each optimized for specific trading timeframes and market approaches. The Smooth Cloud Filter utilizes the mathematical relationship between 150-period and 250-period exponential moving averages, providing stable trend identification suitable for position trading strategies. This configuration generates signals exclusively when price action aligns with cloud direction, creating a more deliberate but highly reliable signal generation process.
The Swing Cloud Filter employs modified Supertrend calculations with parameters specifically optimized for swing trading timeframes. This filter achieves optimal balance between responsiveness and stability, adapting effectively to medium-term price movements while filtering excessive market noise that typically affects shorter-term analytical systems.
For active intraday traders, the Scalping Cloud Filter utilizes accelerated Supertrend calculations designed to capture rapid trend changes effectively. This configuration provides enhanced signal generation frequency suitable for compressed timeframe strategies. The advanced Scalping+ Cloud Filter incorporates Hull Moving Average confirmation, delivering maximum responsiveness for ultra-short-term trading while maintaining signal quality through additional momentum validation processes.
Specialized Assistant Functionality
The system includes two distinct assistant modes that provide supplementary market analysis capabilities. The Trend Assistant Mode activates advanced cloud analysis overlays that display dynamic support and resistance zones calculated through adaptive volatility algorithms. These levels automatically adjust to current market conditions, providing visual guidance for identifying trend continuation patterns and potential reversal areas with mathematical precision.
The Trend Tracker Mode concentrates on long-term trend identification by displaying major exponential moving averages with color-coded fill areas that clarify directional bias. This mode maintains visual simplicity while providing comprehensive trend context evaluation, enabling traders to quickly assess broader market direction and align shorter-term strategies accordingly.
Dynamic Risk Management System
The integrated risk management system automatically adapts across all operational modes, calculating stop loss and take profit targets using Average True Range multiples that adjust to current market volatility. This approach ensures consistent risk parameters regardless of selected operational mode while maintaining relevance to prevailing market conditions.
Stop loss placement occurs at dynamically calculated distances from entry points, while three progressive take profit targets establish at customizable ATR multiples respectively. The system automatically updates these levels upon trend direction changes, ensuring current market volatility influences all risk calculations and maintains appropriate risk-reward ratios throughout trade management.
Comprehensive Market Analysis Dashboard
The sophisticated dashboard provides real-time market analysis including volatility measurements, institutional activity assessment, and multi-timeframe trend evaluation across five-minute through four-hour periods. This comprehensive market context assists traders in selecting appropriate operational modes based on current market characteristics rather than relying exclusively on historical performance data.
The multi-timeframe analysis ensures mode selection considers broader market context beyond the primary trading timeframe, improving overall strategic alignment and reducing conflicts between different temporal market perspectives. The dashboard displays market state classification, volatility percentages, institutional activity levels, current trading session information, and trend pressure indicators with professional formatting and clear visual hierarchy.
Enhanced Trading Assistants
The Fresh Algo V24 includes specialized trading assistant features that complement the primary signal generation system. The Reversal Dot functionality identifies potential reversal points through Wave Trend Oscillator analysis, displaying visual indicators when crossover conditions occur at extreme levels. These reversal indicators provide early warning signals for potential trend changes before they appear in the primary signal system.
The Dynamic Take Profit Labels feature automatically identifies optimal profit-taking opportunities through RSI threshold analysis, marking potential exit points at multiple levels for long positions and corresponding levels for short positions. This automated profit management system helps traders optimize exit timing without requiring constant manual monitoring of technical indicators.
Advanced Alert System
The comprehensive alert system accommodates all operational modes while providing granular notification control for various signal types and risk management events. Traders can configure separate alerts for normal buy signals, strong buy signals, normal sell signals, strong sell signals, stop loss triggers, and individual take profit target achievements.
Cloud crossover alerts notify traders when trend direction changes occur, providing early indication of potential strategy adjustments. The alert system includes detailed trade setup information, timeframe data, and relevant entry and exit levels, ensuring traders receive complete context for informed decision-making without requiring constant chart monitoring.
Technical Foundation Architecture
The Fresh Algo V24 combines multiple proven technical analysis components including Wave Trend Oscillator for momentum assessment, Supertrend for directional bias determination, Squeeze Momentum for volatility analysis, and various exponential moving averages for trend confirmation. Each component contributes specific market insights while the unified system provides comprehensive market evaluation through their mathematical integration.
The multi-component approach reduces dependency on individual indicator limitations while leveraging the analytical strengths of each technical tool. This creates a robust analytical framework capable of adapting to diverse market conditions through appropriate mode selection and parameter optimization, ensuring consistent performance across varying market environments.
Market State Classification
The indicator incorporates advanced market state classification through ADX analysis, distinguishing between trending, ranging, and transitional market conditions. This classification system automatically adjusts signal sensitivity and filtering parameters based on current market characteristics, optimizing performance for prevailing conditions rather than applying static analytical approaches.
The volatility measurement system calculates current market activity levels as percentages, providing quantitative assessment of market energy and helping traders select appropriate operational modes. Institutional activity detection through volume analysis ensures signal generation aligns with professional market participation patterns.
Implementation Strategy Considerations
Successful implementation requires careful matching of operational modes to prevailing market conditions and individual trading objectives. Trending modes demonstrate optimal performance during directional markets with sustained momentum characteristics, while contrarian modes excel during range-bound or overextended market conditions where reversal probability increases.
The cloud filter configurations provide varying degrees of confirmation strength, with smoother settings reducing false signal occurrence at the expense of some responsiveness to price changes. Traders must balance signal quality against signal frequency based on their risk tolerance and available trading time, utilizing the comprehensive customization options to optimize performance for their specific requirements.
Multi-Timeframe Integration
The system provides seamless multi-timeframe analysis through the integrated dashboard, displaying trend alignment across multiple time horizons from five-minute through four-hour periods. This analysis helps traders understand broader market context and avoid conflicts between different temporal perspectives that could compromise trade outcomes.
Session analysis identifies current trading session characteristics, providing context for expected market behavior patterns and helping traders adjust their approach based on typical session volatility and participation levels. This geographic market awareness enhances strategic decision-making and improves timing for trade execution.
Advanced Visualization Features
The indicator includes sophisticated visualization capabilities through gradient candle coloring based on MACD analysis, providing immediate visual feedback on momentum strength and direction. This enhancement allows rapid market assessment without requiring detailed indicator analysis, improving efficiency for traders managing multiple instruments simultaneously.
The cloud visualization system uses color-coded fill areas to clearly indicate trend direction and strength, with automatic adaptation to selected operational modes. This visual clarity reduces analytical complexity while maintaining comprehensive market information display through professional chart presentation.
Performance Optimization Framework
The Fresh Algo V24 incorporates performance optimization features including signal strength classification, automatic parameter adjustment based on market conditions, and dynamic filtering that adapts to current volatility levels. These optimizations ensure consistent performance across varying market environments while maintaining signal quality standards.
The system automatically adjusts sensitivity levels based on selected operational modes, ensuring appropriate responsiveness for different trading approaches. This adaptive framework reduces the need for manual parameter adjustments while maintaining optimal performance characteristics for each operational configuration.
Conclusion
The Mutanabby_AI Fresh Algo V24 represents a comprehensive solution for professional trading analysis, combining multiple analytical approaches with advanced visualization and risk management capabilities. The system's strength lies in its adaptive multi-mode design and sophisticated filtering mechanisms, providing traders with versatile tools for various market conditions and trading styles.
Success with this system requires understanding the relationship between different operational modes and their optimal application scenarios. The comprehensive dashboard and alert system provide essential market context and trade management support, enabling systematic approach to market analysis while maintaining flexibility for individual trading preferences.
The indicator's sophisticated architecture and extensive customization options make it suitable for traders at all experience levels, from those seeking systematic signal generation to advanced practitioners requiring comprehensive market analysis tools. The multi-timeframe integration and adaptive filtering ensure consistent performance across diverse market conditions while providing clear guidelines for strategic implementation.

VIX Filter/RSI/EMA Bias/Cum-TICK w/ Exhaustion Zone DashboardThis all-in-one dashboard gives intraday traders a real-time visual read of market conditions, combining volatility regime, trend bias, momentum exhaustion, and internal strength — all in a fully customizable overlay that won’t clutter your chart.
📉 VIX Market Regime Detector
Identifies "Weak", "Normal", "Volatile", or "Danger" market states based on customizable VIX ranges and symbol (e.g., VXN or VIX).
📊 RSI Momentum Readout
Displays real-time RSI from any selected timeframe or symbol, with adjustable length, OB/OS thresholds, and color-coded exhaustion alerts.
📈 EMA Trend Bias Scanner
Compares fast and slow EMAs to define bullish or bearish bias, using your preferred timeframe, symbol, and EMA lengths — ideal for multi-timeframe setups.
🧠 Cumulative TICK Pressure & Exhaustion Engine
Analyzes internal market strength using cumulative TICK data to classify conditions as:
-Strong / Mild Bullish or Bearish Pressure
-Choppy / No Edge
-⚠️ Exhaustion Zones — when raw TICK values hit extreme highs/lows, a separate highlight box appears in the dashboard, warning of potential turning points
All logic is customizable, including TICK symbol, timeframes, thresholds, and lookback periods.
Scalpers and day traders who want fast, visual insight into market internals, exhaustion, and trend bias.

Volume-Enhanced Candlestick Patterns 1
Overview
Scans for four major candlestick reversal patterns:
Harami
Engulfing
Morning/Evening Star
Piercing Line/Dark Cloud Cover
Underlying logic assumes that, at a turning point, the dominant side (bulls or bears) often delivers a “final” push—either a last surge of buying or selling—before the reversal truly takes hold.
Pattern Toggles
Each individual pattern can be turned on or off in the inputs.
Enable only the patterns you want to monitor to reduce chart clutter and speed up performance.
Volume Filter Toggle
On: Requires volume-based exhaustion or climax to confirm each pattern.
Off: Relies purely on price-action candlestick logic (no volume checks).
Grouped Labels & Confluence
When one or more patterns trigger on the same bar close, a single label is drawn:
Grouping multiple confirmed patterns on one bar increases confluence and signal strength.
Climax Volume × Multiplier
Adjusting this input affects signal frequency and conviction:
Higher multiplier → fewer signals but with stronger volume confirmation
Lower multiplier → more signals, each with a looser volume requirement
Alerts
Built-in alert condition for each individual pattern (bullish/bearish Harami, Engulfing, Star, Piercing, Dark Cloud Cover), so you can receive real-time notifications whenever a confirmation occurs.
Follow for Weekly Scripts
If you find this helpful, please hit Follow and 🚀button —I release a new scripts every week.
Disclaimer
Not Financial Advice. This script is for educational and research purposes only.
Use as Part of a Larger System. It should not be used in isolation; combine it with your own risk management rules, additional indicators, and broader market analysis.
No Guarantees. Candlestick patterns and volume filters can improve signal quality, but they do not guarantee profitable trades. Always perform your own due diligence before entering any position.

Apex Edge - MTF Confluence PanelApex Edge – MTF Confluence Panel
Description:
The Apex Edge – MTF Confluence Panel is a powerful multi-timeframe analysis tool built to streamline trade decision-making by aggregating key confluences across three user-defined timeframes. The panel visually presents the state of five core market signals—Trend, Momentum, Sweep, Structure, and Trap—alongside a unified Score column that summarizes directional bias with clarity.
Traders can customize the number of bullish/bearish conditions required to trigger a score signal, allowing the tool to be tailored for both conservative and aggressive trading styles. This script is designed for those who value a clean, structured, and objective approach to identifying market alignment—whether scalping or swing trading.
How it Works:
Across each of the three selected timeframes, the panel evaluates:
Trend: Based on a user-configurable Hull Moving Average (HMA), the script compares price relative to trend to determine bullish, bearish, or neutral bias.
Momentum: Uses OBV (On-Balance Volume) with volume spike detection to identify bursts of strong buying or selling pressure.
Sweep: Detects potential liquidity grabs by identifying price rejections beyond prior swing highs/lows. A break below a previous low with reversal signals bullish intent (and vice versa for bearish).
Structure: Uses dynamic pivot-based logic to identify market structure breaks (BOS) beyond recent confirmed swing levels.
Trap: Flags potential false moves by measuring RSI overbought/oversold signal clusters combined with minimal price movement—highlighting exhaustion or deceptive breaks.
Score: A weighted consensus of the above components. The number of required confluences to trigger a score (default: 3) can be set by the user via input, offering flexibility in signal sensitivity.
Why It’s Useful for Traders:
Quick Decision-Making: The color-coded panel provides instant visual feedback on whether confluences align across timeframes—ideal for fast-paced environments like scalping or high-volatility news sessions.
Multi-Timeframe Confidence: Helps eliminate guesswork by confirming whether higher and lower timeframe conditions support your trade idea.
Customizability: Adjustable confluence threshold means traders can fine-tune how sensitive the system is—more signals for faster entries, stricter confluence for higher conviction trades.
Built-In Alerts: Automated alerts for score alignment, trap detection, and liquidity sweeps allow traders to stay informed even when away from the screen.
Strategic Edge: Supports directional bias confirmation and trade filtering with logic designed to mimic professional decision-making workflows.
Features:
Clean, real-time confluence table across three user-selected timeframes
Configurable score sensitivity via “Minimum Confluences for Score” input
Cell-based colour coding for at-a-glance trade direction
Built-in alerts for score alignment, traps, and sweep triggers
Note - This Indicator works great in sync with Apex Edge - Session Sweep Pro
Useful levels for TP = previous session high/low boxes or fib levels.
⚠️ Disclaimer:
This script is for informational and educational purposes only and should not be considered financial advice. Always perform your own due diligence and practice proper risk management when trading.

Multi-Time Frame DMI with Gradient Bar ColoringDisplays a table showing the Directional Movement Index (DMI) sentiment for multiple time frames based on the Average Directional Index (ADX) value for each time frame.
Table Position and Text Size are configurable, with two styles (vertical or horizontal) available.
Time frame labels can be toggled off for color-only table.
Bars are colored based on the ADX value using a color gradient between the bullish and bearish color inputs. The neutral color is independent of the gradient for contrast.

Multi-Fibonacci Trend Average[FibonacciFlux]Multi-Fibonacci Trend Average (MFTA): An Institutional-Grade Trend Confluence Indicator for Discerning Market Participants
My original indicator/Strategy:
Engineered for the sophisticated demands of institutional and advanced traders, the Multi-Fibonacci Trend Average (MFTA) indicator represents a paradigm shift in technical analysis. This meticulously crafted tool is designed to furnish high-definition trend signals within the complexities of modern financial markets. Anchored in the rigorous principles of Fibonacci ratios and augmented by advanced averaging methodologies, MFTA delivers a granular perspective on trend dynamics. Its integration of Multi-Timeframe (MTF) filters provides unparalleled signal robustness, empowering strategic decision-making with a heightened degree of confidence.
MFTA indicator on BTCUSDT 15min chart with 1min RSI and MACD filters enabled. Note the refined signal generation with reduced noise.
MFTA indicator on BTCUSDT 15min chart without MTF filters. While capturing more potential trading opportunities, it also generates a higher frequency of signals, including potential false positives.
Core Innovation: Proprietary Fibonacci-Enhanced Supertrend Averaging Engine
The MFTA indicator’s core innovation lies in its proprietary implementation of Supertrend analysis, strategically fortified by Fibonacci ratios to construct a truly dynamic volatility envelope. Departing from conventional Supertrend methodologies, MFTA autonomously computes not one, but three distinct Supertrend lines. Each of these lines is uniquely parameterized by a specific Fibonacci factor: 0.618 (Weak), 1.618 (Medium/Golden Ratio), and 2.618 (Strong/Extended Fibonacci).
// Fibonacci-based factors for multiple Supertrend calculations
factor1 = input.float(0.618, 'Factor 1 (Weak/Fibonacci)', minval=0.01, step=0.01, tooltip='Factor 1 (Weak/Fibonacci)', group="Fibonacci Supertrend")
factor2 = input.float(1.618, 'Factor 2 (Medium/Golden Ratio)', minval=0.01, step=0.01, tooltip='Factor 2 (Medium/Golden Ratio)', group="Fibonacci Supertrend")
factor3 = input.float(2.618, 'Factor 3 (Strong/Extended Fib)', minval=0.01, step=0.01, tooltip='Factor 3 (Strong/Extended Fib)', group="Fibonacci Supertrend")
This multi-faceted architecture adeptly captures a spectrum of market volatility sensitivities, ensuring a comprehensive assessment of prevailing conditions. Subsequently, the indicator algorithmically synthesizes these disparate Supertrend lines through arithmetic averaging. To achieve optimal signal fidelity and mitigate inherent market noise, this composite average is further refined utilizing an Exponential Moving Average (EMA).
// Calculate average of the three supertends and a smoothed version
superlength = input.int(21, 'Smoothing Length', tooltip='Smoothing Length for Average Supertrend', group="Fibonacci Supertrend")
average_trend = (supertrend1 + supertrend2 + supertrend3) / 3
smoothed_trend = ta.ema(average_trend, superlength)
The resultant ‘Smoothed Trend’ line emerges as a remarkably responsive yet stable trend demarcation, offering demonstrably superior clarity and precision compared to singular Supertrend implementations, particularly within the turbulent dynamics of high-volatility markets.
Elevated Signal Confluence: Integrated Multi-Timeframe (MTF) Validation Suite
MFTA transcends the limitations of conventional trend indicators by incorporating an advanced suite of three independent MTF filters: RSI, MACD, and Volume. These filters function as sophisticated validation protocols, rigorously ensuring that only signals exhibiting a confluence of high-probability factors are brought to the forefront.
1. Granular Lower Timeframe RSI Momentum Filter
The Relative Strength Index (RSI) filter, computed from a user-defined lower timeframe, furnishes critical momentum-based signal validation. By meticulously monitoring RSI dynamics on an accelerated timeframe, traders gain the capacity to evaluate underlying momentum strength with precision, prior to committing to signal execution on the primary chart timeframe.
// --- Lower Timeframe RSI Filter ---
ltf_rsi_filter_enable = input.bool(false, title="Enable RSI Filter", group="MTF Filters", tooltip="Use RSI from lower timeframe as a filter")
ltf_rsi_timeframe = input.timeframe("1", title="RSI Timeframe", group="MTF Filters", tooltip="Timeframe for RSI calculation")
ltf_rsi_length = input.int(14, title="RSI Length", minval=1, group="MTF Filters", tooltip="Length for RSI calculation")
ltf_rsi_threshold = input.int(30, title="RSI Threshold", minval=0, maxval=100, group="MTF Filters", tooltip="RSI value threshold for filtering signals")
2. Convergent Lower Timeframe MACD Trend-Momentum Filter
The Moving Average Convergence Divergence (MACD) filter, also calculated on a lower timeframe basis, introduces a critical layer of trend-momentum convergence confirmation. The bullish signal configuration rigorously mandates that the MACD line be definitively positioned above the Signal line on the designated lower timeframe. This stringent condition ensures a robust indication of converging momentum that aligns synergistically with the prevailing trend identified on the primary timeframe.
// --- Lower Timeframe MACD Filter ---
ltf_macd_filter_enable = input.bool(false, title="Enable MACD Filter", group="MTF Filters", tooltip="Use MACD from lower timeframe as a filter")
ltf_macd_timeframe = input.timeframe("1", title="MACD Timeframe", group="MTF Filters", tooltip="Timeframe for MACD calculation")
ltf_macd_fast_length = input.int(12, title="MACD Fast Length", minval=1, group="MTF Filters", tooltip="Fast EMA length for MACD")
ltf_macd_slow_length = input.int(26, title="MACD Slow Length", minval=1, group="MTF Filters", tooltip="Slow EMA length for MACD")
ltf_macd_signal_length = input.int(9, title="MACD Signal Length", minval=1, group="MTF Filters", tooltip="Signal SMA length for MACD")
3. Definitive Volume Confirmation Filter
The Volume Filter functions as an indispensable arbiter of trade conviction. By establishing a dynamic volume threshold, defined as a percentage relative to the average volume over a user-specified lookback period, traders can effectively ensure that all generated signals are rigorously validated by demonstrably increased trading activity. This pivotal validation step signifies robust market participation, substantially diminishing the potential for spurious or false breakout signals.
// --- Volume Filter ---
volume_filter_enable = input.bool(false, title="Enable Volume Filter", group="MTF Filters", tooltip="Use volume level as a filter")
volume_threshold_percent = input.int(title="Volume Threshold (%)", defval=150, minval=100, group="MTF Filters", tooltip="Minimum volume percentage compared to average volume to allow signal (100% = average)")
These meticulously engineered filters operate in synergistic confluence, requiring all enabled filters to definitively satisfy their pre-defined conditions before a Buy or Sell signal is generated. This stringent multi-layered validation process drastically minimizes the incidence of false positive signals, thereby significantly enhancing entry precision and overall signal reliability.
Intuitive Visual Architecture & Actionable Intelligence
MFTA provides a demonstrably intuitive and visually rich charting environment, meticulously delineating trend direction and momentum through precisely color-coded plots:
Average Supertrend: Thin line, green/red for uptrend/downtrend, immediate directional bias.
Smoothed Supertrend: Bold line, teal/purple for uptrend/downtrend, cleaner, institutionally robust trend.
Dynamic Trend Fill: Green/red fill between Supertrends quantifies trend strength and momentum.
Adaptive Background Coloring: Light green/red background mirrors Smoothed Supertrend direction, holistic trend perspective.
Precision Buy/Sell Signals: ‘BUY’/‘SELL’ labels appear on chart when trend touch and MTF filter confluence are satisfied, facilitating high-conviction trade action.
MFTA indicator applied to BTCUSDT 4-hour chart, showcasing its effectiveness on higher timeframes. The Smoothed Length parameter is increased to 200 for enhanced smoothness on this timeframe, coupled with 1min RSI and Volume filters for signal refinement. This illustrates the indicator's adaptability across different timeframes and market conditions.
Strategic Applications for Institutional Mandates
MFTA’s sophisticated design provides distinct advantages for advanced trading operations and institutional investment mandates. Key strategic applications include:
High-Probability Trend Identification: Fibonacci-averaged Supertrend with MTF filters robustly identifies high-probability trend continuations and reversals, enhancing alpha generation.
Precision Entry/Exit Signals: Volume and momentum-filtered signals enable institutional-grade precision for optimized risk-adjusted returns.
Algorithmic Trading Integration: Clear signal logic facilitates seamless integration into automated trading systems for scalable strategy deployment.
Multi-Asset/Timeframe Versatility: Adaptable parameters ensure applicability across diverse asset classes and timeframes, catering to varied trading mandates.
Enhanced Risk Management: Superior signal fidelity from MTF filters inherently reduces false signals, supporting robust risk management protocols.
Granular Customization and Parameterized Control
MFTA offers unparalleled customization, empowering users to fine-tune parameters for precise alignment with specific trading styles and market conditions. Key adjustable parameters include:
Fibonacci Factors: Adjust Supertrend sensitivity to volatility regimes.
ATR Length: Control volatility responsiveness in Supertrend calculations.
Smoothing Length: Refine Smoothed Trend line responsiveness and noise reduction.
MTF Filter Parameters: Independently configure timeframes, lookback periods, and thresholds for RSI, MACD, and Volume filters for optimal signal filtering.
Disclaimer
MFTA is meticulously engineered for high-quality trend signals; however, no indicator guarantees profit. Market conditions are unpredictable, and trading involves substantial risk. Rigorous backtesting and forward testing across diverse datasets, alongside a comprehensive understanding of the indicator's logic, are essential before live deployment. Past performance is not indicative of future results. MFTA is for informational and analytical purposes only and is not financial or investment advice.

Multi-Timeframe MACD Strategy ver 1.0Multi-Timeframe MACD Strategy: Enhanced Trend Trading with Customizable Entry and Trailing Stop
This strategy utilizes the Moving Average Convergence Divergence (MACD) indicator across multiple timeframes to identify strong trends, generate precise entry and exit signals, and manage risk with an optional trailing stop loss. By combining the insights of both the current chart's timeframe and a user-defined higher timeframe, this strategy aims to improve trade accuracy, reduce exposure to false signals, and capture larger market moves.
Key Features:
Dual Timeframe Analysis: Calculates and analyzes the MACD on both the current chart's timeframe and a user-selected higher timeframe (e.g., Daily MACD on a 1-hour chart). This provides a broader market context, helping to confirm trends and filter out short-term noise.
Configurable MACD: Fine-tune the MACD calculation with adjustable Fast Length, Slow Length, and Signal Length parameters. Optimize the indicator's sensitivity to match your trading style and the volatility of the asset.
Flexible Entry Options: Choose between three distinct entry types:
Crossover: Enters trades when the MACD line crosses above (long) or below (short) the Signal line.
Zero Cross: Enters trades when the MACD line crosses above (long) or below (short) the zero line.
Both: Combines both Crossover and Zero Cross signals, providing more potential entry opportunities.
Independent Timeframe Control: Display and trade based on the current timeframe MACD, the higher timeframe MACD, or both. This allows you to focus on the information most relevant to your analysis.
Optional Trailing Stop Loss: Implements a configurable trailing stop loss to protect profits and limit potential losses. The trailing stop is adjusted dynamically as the price moves in your favor, based on a user-defined percentage.
No Repainting: Employs lookahead=barmerge.lookahead_off in the request.security() function to prevent data leakage and ensure accurate backtesting and real-time signals.
Clear Visual Signals (Optional): Includes optional plotting of the MACD and Signal lines for both timeframes, with distinct colors for easy visual identification. These plots are for visual confirmation and are not required for the strategy's logic.
Suitable for Various Trading Styles: Adaptable to swing trading, day trading, and trend-following strategies across diverse markets (stocks, forex, cryptocurrencies, etc.).
Fully Customizable: All parameters are adjustable, including timeframes, MACD Settings, Entry signal type and trailing stop settings.
How it Works:
MACD Calculation: The strategy calculates the MACD (using the standard formula) for both the current chart's timeframe and the specified higher timeframe.
Trend Identification: The relationship between the MACD line, Signal line, and zero line is used to determine the current trend for each timeframe.
Entry Signals: Buy/sell signals are generated based on the selected "Entry Type":
Crossover: A long signal is generated when the MACD line crosses above the Signal line, and both timeframes are in agreement (if both are enabled). A short signal is generated when the MACD line crosses below the Signal line, and both timeframes are in agreement.
Zero Cross: A long signal is generated when the MACD line crosses above the zero line, and both timeframes agree. A short signal is generated when the MACD line crosses below the zero line and both timeframes agree.
Both: Combines Crossover and Zero Cross signals.
Trailing Stop Loss (Optional): If enabled, a trailing stop loss is set at a specified percentage below (for long positions) or above (for short positions) the entry price. The stop-loss is automatically adjusted as the price moves favorably.
Exit Signals:
Without Trailing Stop: Positions are closed when the MACD signals reverse according to the selected "Entry Type" (e.g., a long position is closed when the MACD line crosses below the Signal line if using "Crossover" entries).
With Trailing Stop: Positions are closed if the price hits the trailing stop loss.
Backtesting and Optimization: The strategy automatically backtests on the chart's historical data, allowing you to assess its performance and optimize parameters for different assets and timeframes.
Example Use Cases:
Confirming Trend Strength: A trader on a 1-hour chart sees a bullish MACD crossover on the current timeframe. They check the MTF MACD strategy and see that the Daily MACD is also bullish, confirming the strength of the uptrend.
Filtering Noise: A trader using a 15-minute chart wants to avoid false signals from short-term volatility. They use the strategy with a 4-hour higher timeframe to filter out noise and only trade in the direction of the dominant trend.
Dynamic Risk Management: A trader enters a long position and enables the trailing stop loss. As the price rises, the trailing stop is automatically adjusted upwards, protecting profits. The trade is exited either when the MACD reverses or when the price hits the trailing stop.
Disclaimer:
The MACD is a lagging indicator and can produce false signals, especially in ranging markets. This strategy is for educational and informational purposes only and should not be considered financial advice. Backtest and optimize the strategy thoroughly, combine it with other technical analysis tools, and always implement sound risk management practices before using it with real capital. Past performance is not indicative of future results. Conduct your own due diligence and consider your risk tolerance before making any trading decisions.

Multi-Timeframe Parabolic SAR Strategy ver 1.0Multi-Timeframe Parabolic SAR Strategy (MTF PSAR) - Enhanced Trend Trading
This strategy leverages the power of the Parabolic SAR (Stop and Reverse) indicator across multiple timeframes to provide robust trend identification, precise entry/exit signals, and dynamic trailing stop management. By combining the insights of both the current chart's timeframe and a user-defined higher timeframe, this strategy aims to improve trading accuracy, reduce risk, and capture more significant market moves.
Key Features:
Dual Timeframe Analysis: Simultaneously analyzes the Parabolic SAR on the current chart and a higher timeframe (e.g., Daily PSAR on a 1-hour chart). This allows you to align your trades with the dominant trend and filter out noise from lower timeframes.
Configurable PSAR: Fine-tune the PSAR calculation with adjustable Start, Increment, and Maximum values to optimize sensitivity for your trading style and the asset's volatility.
Independent Timeframe Control: Choose to display and trade based on either or both the current timeframe PSAR and the higher timeframe PSAR. Focus on the most relevant information for your analysis.
Clear Visual Signals: Distinct colors for the current and higher timeframe PSAR dots provide a clear visual representation of potential entry and exit points.
Multiple Entry Strategies: The strategy offers flexible entry conditions, allowing you to trade based on:
Confirmation: Both current and higher timeframe PSAR signals agree and the current timeframe PSAR has just flipped direction. (Most conservative)
Current Timeframe Only: Trades based solely on the current timeframe PSAR, ideal for when the higher timeframe is less relevant or disabled.
Higher Timeframe Only: Trades based solely on the higher timeframe PSAR.
Dynamic Trailing Stop (PSAR-Based): Implements a trailing stop-loss based on the current timeframe's Parabolic SAR. This helps protect profits by automatically adjusting the stop-loss as the price moves in your favor. Exits are triggered when either the current or HTF PSAR flips.
No Repainting: Uses lookahead=barmerge.lookahead_off in the security() function to ensure that the higher timeframe data is accessed without any data leakage, preventing repainting issues.
Fully Configurable: All parameters (PSAR settings, higher timeframe, visibility, colors) are adjustable through the strategy's settings panel, allowing for extensive customization and optimization.
Suitable for Various Trading Styles: Applicable to swing trading, day trading, and trend-following strategies across various markets (stocks, forex, cryptocurrencies, etc.).
How it Works:
PSAR Calculation: The strategy calculates the standard Parabolic SAR for both the current chart's timeframe and the selected higher timeframe.
Trend Identification: The direction of the PSAR (dots below price = uptrend, dots above price = downtrend) determines the current trend for each timeframe.
Entry Signals: The strategy generates buy/sell signals based on the chosen entry strategy (Confirmation, Current Timeframe Only, or Higher Timeframe Only). The Confirmation strategy offers the highest probability signals by requiring agreement between both timeframes.
Trailing Stop Exit: Once a position is entered, the strategy uses the current timeframe PSAR as a dynamic trailing stop. The stop-loss is automatically adjusted as the PSAR dots move, helping to lock in profits and limit losses. The strategy exits when either the Current or HTF PSAR changes direction.
Backtesting and Optimization: The strategy automatically backtests on the chart's historical data, allowing you to evaluate its performance and optimize the settings for different assets and timeframes.
Example Use Cases:
Trend Confirmation: A trader on a 1-hour chart observes a bullish PSAR flip on the current timeframe. They check the MTF PSAR strategy and see that the Daily PSAR is also bullish, confirming the strength of the uptrend and providing a high-probability long entry signal.
Filtering Noise: A trader on a 5-minute chart wants to avoid whipsaws caused by short-term price fluctuations. They use the strategy with a 1-hour higher timeframe to filter out noise and only trade in the direction of the dominant trend.
Dynamic Risk Management: A trader enters a long position and uses the current timeframe PSAR as a trailing stop. As the price rises, the PSAR dots move upwards, automatically raising the stop-loss and protecting profits. The trade is exited when the current (or HTF) PSAR flips to bearish.
Disclaimer:
The Parabolic SAR is a lagging indicator and can produce false signals, particularly in ranging or choppy markets. This strategy is intended for educational and informational purposes only and should not be considered financial advice. It is essential to backtest and optimize the strategy thoroughly, use it in conjunction with other technical analysis tools, and implement sound risk management practices before using it with real capital. Past performance is not indicative of future results. Always conduct your own due diligence and consider your risk tolerance before making any trading decisions.
