VWAP Periodic Close [LuxAlgo]The VWAP Periodic Close script offers an advanced tool for analyzing the Volume Weighted Average Price (VWAP) across various timeframes.
This tool enables traders to visualize VWAP close levels for daily, weekly, monthly, quarterly, and yearly periods, offering a comprehensive view of price behavior across different time frames. It helps in identifying key levels where the VWAP closes at the end of each specified period.
🔶 USAGE
This script is designed to enhance your trading strategy by plotting VWAP close levels on your chart for different time periods. This helps traders easily identify historical VWAP levels and analyze price action relative to these levels, particularly useful for identifying key support and resistance levels providing insights into potential future price behavior.
Supports VWAP closes for multiple timeframes, including historical periods (e.g., 3 months back, 3 quarters back, 3 years back). The labels provide context and detailed information about the VWAP close at a specific point in time and enhance the clarity and usefulness of the VWAP data presented on the chart.
Users can toggle the display of VWAP lines for different periods and customize the colors for each timeframe (e.g., distinct colors for monthly, quarterly, and yearly closes).
🔶 SETTINGS
The script offers a range of customizable settings to tailor the analysis to your trading needs.
🔹 Volume Weighted Average Price (VWAP)
VWAP Close Level: Toggle the display of VWAP levels at the end of each period (daily, weekly, monthly, quarterly, yearly).
VWAP Origin: Toggle the display of the VWAP line for each period.
VWAP Source: Choose the data source for VWAP calculations (default is HLC3).
Historical Closes: Define the number of historical VWAP levels to plot.
Line/Label Offset: Adjust the offset for positioning lines and labels on the chart.
🔹 Themes
Theme Selection: Choose between "Day," "Night," or "Custom" themes to adjust the color scheme of VWAP lines and labels.
Multitimeframeanalysis

Stock Strength IndexScript Title: Stock Strength Index made by Vishal R Janjire
Description:
The Stock Strength Index combines several advanced technical analysis tools into one comprehensive Pine Script indicator designed to provide a nuanced view of market strength and trends. This script integrates Relative Strength (RS), Commodity Channel Index (CCI), and additional trend confirmation mechanisms to deliver actionable insights for traders.
( Must Read )
Important parameter read before use this indicator
0. Zero line green means stock is in up trend and if it is red means down trending.
1. Zero line is green it means stocks is outperforming its index that is Nifty 50 ( but dont consider its results on nifty itself that is it will not work only on nifty 50)
2. Zero line is red it means stocks is underperforming its index that is Nifty 50
3. bubble is confirmation tool when it show green bubble on zero line it means on short time frame it want go up trending and vise versa
4. Always remember higher time frame is greater than chart time frame like day vs hour
Key Features:
5. Best suitable time when higher time frame is 15 minutes and chart time is 5 minute for intraday trading. for short swing use HTF 1 Day and chart time is 1 hour or 2 hour.
1. Relative Strength (RS) Analysis:
- Calculation: Measures the performance of the base symbol relative to a comparative symbol over a specified period.
- Visualization: Plots the RS value with color-coded lines to indicate bullish (green) or bearish (red) conditions based on crossovers. Users can toggle the RS color based on its value or trend direction.
- Trend Analysis: Displays a simple moving average (SMA) of RS to visualize trend strength and direction. The SMA’s color changes to indicate rising or falling trends.
2. Commodity Channel Index (CCI):
- Current Timeframe CCI: Calculates the CCI for the current timeframe to assess price momentum.
- Higher Timeframe CCI: Computes the CCI for a higher timeframe to provide a broader market perspective.
- Background Color: Highlights the chart background in green or red based on whether both current and higher timeframe CCIs are above or below zero, respectively.
3. Alerts:
- CCI Alerts: Set up alerts for key CCI crossovers, including when both CCIs are above or below zero, or when CCI crosses key levels (100 and -100) on either timeframe.
4. Trend Confirmation:
- Price Confirmation: Uses price and its moving average to identify bullish or bearish divergence, with visual bubbles plotted on the chart to confirm potential trade signals.
5. Customization Options:
- RS Parameters: Adjust settings for RS period, comparative symbol, and whether to display reference labels or the zero line.
- CCI Parameters: Configure CCI lengths for both current and higher timeframes and select the source of the CCI calculation.
Concepts Underlying Calculations:
- Relative Strength (RS): Measures the relative performance of the base symbol compared to another symbol, adjusted over a specified period to capture momentum and trend strength.
- Commodity Channel Index (CCI): Calculates the deviation of the price from its average to identify overbought or oversold conditions and potential reversal points.
- Simple Moving Average (SMA): Smooths the RS values to highlight trends and potential trend reversals.
This indicator is designed for traders seeking a comprehensive tool that combines multiple analytical methods into one cohesive system. It aims to offer a clearer view of market trends, strengths, and potential trade opportunities based on a blend of relative strength and momentum indicators.
---
This description provides a detailed overview of the script's functionality and customization options while ensuring clarity and compliance with the publishing rules.

OrderFlow [Adjustable] | FractalystWhat's the indicator's purpose and functionality?
This indicator is designed to assist traders in identifying real-time probabilities of buyside and sellside liquidity .
It allows for an adjustable pivot level , enabling traders to customize the level they want to use for their entries.
By doing so, traders can evaluate whether their chosen entry point would yield a positive expected value over a large sample size, optimizing their strategy for long-term profitability.
For advanced traders looking to enhance their analysis, the indicator supports the incorporation of up to 7 higher timeframe biases .
Additionally, the higher timeframe pivot level can be adjusted according to the trader's preferences,
Offering maximum adaptability to different strategies and needs, further helping to maximize positive EV.
EV=(P(Win)×R(Win))−(P(Loss)×R(Loss))
-----
What's the purpose of these levels? What are the underlying calculations?
1. Understanding Swing highs and Swing Lows
Swing High: A Swing High is formed when there is a high with 2 lower highs to the left and right.
Swing Low: A Swing Low is formed when there is a low with 2 higher lows to the left and right.
2. Understanding the purpose and the underlying calculations behind Buyside, Sellside and Pivot levels.
3. Identifying Discount and Premium Zones.
4. Importance of Risk-Reward in Premium and Discount Ranges
----
How does the script calculate probabilities?
The script calculates the probability of each liquidity level individually. Here's the breakdown:
1. Upon the formation of a new range, the script waits for the price to reach and tap into pivot level level. Status: "⏸" - Inactive
2. Once pivot level is tapped into, the pivot status becomes activated and it waits for either liquidity side to be hit. Status: "▶" - Active
3. If the buyside liquidity is hit, the script adds to the count of successful buyside liquidity occurrences. Similarly, if the sellside is tapped, it records successful sellside liquidity occurrences.
4. Finally, the number of successful occurrences for each side is divided by the overall count individually to calculate the range probabilities.
Note: The calculations are performed independently for each directional range. A range is considered bearish if the previous breakout was through a sellside liquidity. Conversely, a range is considered bullish if the most recent breakout was through a buyside liquidity.
----
What does the multi-timeframe functionality offer?
In the adjustable version of the orderflow indicator, you can incorporate up to 7 higher timeframe probabilities directly into the table.
This feature allows you to analyze the probabilities of buyside and sellside liquidity across multiple timeframes, without the need to manually switch between them.
By viewing these higher timeframe probabilities in one place, traders can spot larger market trends and refine their entries and exits with a better understanding of the overall market context.
This multi-timeframe functionality helps traders:
1. Simplify decision-making by offering a comprehensive view of multiple timeframes at once.
2. Identify confluence between timeframes, enhancing the confidence in trade setups.
3. Adapt strategies more effectively, as the higher timeframe pivot levels can be customized to meet individual preferences and goals.
----
What are the multi-timeframe underlying calculations?
The script uses the same calculations (mentioned above) and uses security function to request the data such as price levels, bar time, probabilities and booleans from the user-input timeframe.
----
How does the Indicator Identifies Positive Expected Values?
OrderFlow indicator instantly calculates whether a trade setup has the potential for positive expected value (EV) in the long run.
To determine a positive EV setup, the indicator uses the formula:
EV=(P(Win)×R(Win))−(P(Loss)×R(Loss))
where:
P(Win) is the probability of a winning trade.
R(Win) is the reward or return for a winning trade, determined by the current risk-to-reward ratio (RR).
P(Loss) is the probability of a losing trade.
R(Loss) is the loss incurred per losing trade, typically assumed to be -1.
By calculating these values based on historical data and the current trading setup, the indicator helps you understand whether your trade has a positive expected value over a large sample size.
----
How can I know that the setup I'm going to trade with has a postive EV?
If the indicator detects that the adjusted pivot and buy/sell side probabilities have generated positive expected value (EV) in historical data, the risk-to-reward (RR) label within the range box will be colored blue and red .
If the setup does not produce positive EV, the RR label will appear gray.
This indicates that even the risk-to-reward ratio is greater than 1:1, the setup is not likely to yield a positive EV because, according to historical data, the number of losses outweighs the number of wins relative to the RR gain per winning trade.
----
What is the confidence level in the indicator, and how is it determined?
The confidence level in the indicator reflects the reliability of the probabilities calculated based on historical data. It is determined by the sample size of the probabilities used in the calculations. A larger sample size generally increases the confidence level, indicating that the probabilities are more reliable and consistent with past performance.
----
How does the confidence level affect the risk-to-reward (RR) label?
The confidence level (★) is visually represented alongside the probability label. A higher confidence level indicates that the probabilities used to determine the RR label are based on a larger and more reliable sample size.
----
How can traders use the confidence level to make better trading decisions?
Traders can use the confidence level to gauge the reliability of the probabilities and expected value (EV) calculations provided by the indicator. A confidence level above 95% is considered statistically significant and indicates that the historical data supporting the probabilities is robust. This high confidence level suggests that the probabilities are reliable and that the indicator’s recommendations are more likely to be accurate.
In data science and statistics, a confidence level above 95% generally means that there is less than a 5% chance that the observed results are due to random variation. This threshold is widely accepted in research and industry as a marker of statistical significance. Studies such as those published in the Journal of Statistical Software and the American Statistical Association support this threshold, emphasizing that a confidence level above 95% provides a strong assurance of data reliability and validity.
Conversely, a confidence level below 95% indicates that the sample size may be insufficient and that the data might be less reliable . In such cases, traders should approach the indicator’s recommendations with caution and consider additional factors or further analysis before making trading decisions.
----
How does the sample size affect the confidence level, and how does it relate to my TradingView plan?
The sample size for calculating the confidence level is directly influenced by the amount of historical data available on your charts. A larger sample size typically leads to more reliable probabilities and higher confidence levels.
Here’s how the TradingView plans affect your data access:
Essential Plan
The Essential Plan provides basic data access with a limited amount of historical data. This can lead to smaller sample sizes and lower confidence levels, which may weaken the robustness of your probability calculations. Suitable for casual traders who do not require extensive historical analysis.
Plus Plan
The Plus Plan offers more historical data than the Essential Plan, allowing for larger sample sizes and more accurate confidence levels. This enhancement improves the reliability of indicator calculations. This plan is ideal for more active traders looking to refine their strategies with better data.
Premium Plan
The Premium Plan grants access to extensive historical data, enabling the largest sample sizes and the highest confidence levels. This plan provides the most reliable data for accurate calculations, with up to 20,000 historical bars available for analysis. It is designed for serious traders who need comprehensive data for in-depth market analysis.
PRO+ Plans
The PRO+ Plans offer the most extensive historical data, allowing for the largest sample sizes and the highest confidence levels. These plans are tailored for professional traders who require advanced features and significant historical data to support their trading strategies effectively.
For many traders, the Premium Plan offers a good balance of affordability and sufficient sample size for accurate confidence levels.
----
What is the HTF probability table and how does it work?
The HTF (Higher Time Frame) probability table is a feature that allows you to view buy and sellside probabilities and their status from timeframes higher than your current chart timeframe.
Here’s how it works:
Data Request : The table requests and retrieves data from user-defined higher timeframes (HTFs) that you select.
Probability Display: It displays the buy and sellside probabilities for each of these HTFs, providing insights into the likelihood of price movements based on higher timeframe data.
Detailed Tooltips: The table includes detailed tooltips for each timeframe, offering additional context and explanations to help you understand the data better.
----
What do the different colors in the HTF probability table indicate?
The colors in the HTF probability table provide visual cues about the expected value (EV) of trading setups based on higher timeframe probabilities:
Blue: Suggests that entering a long position from the HTF user-defined pivot point, targeting buyside liquidity, is likely to result in a positive expected value (EV) based on historical data and sample size.
Red: Indicates that entering a short position from the HTF user-defined pivot point, targeting sellside liquidity, is likely to result in a positive expected value (EV) based on historical data and sample size.
Gray: Shows that neither long nor short trades from the HTF user-defined pivot point are expected to generate positive EV, suggesting that trading these setups may not be favorable.
----
How to use the indicator effectively?
For Amateur Traders:
Start Simple: Begin by focusing on one timeframe at a time with the pivot level set to the default (50%). This helps you understand the basic functionality of the indicator.
Entry and Exit Strategy: Focus on entering trades at the pivot level while targeting the higher probability side for take profit and the lower probability side for stop loss.
Use simulation or paper trading to practice this strategy.
Adjustments: Once you have a solid understanding of how the indicator works, you can start adjusting the pivot level to other values that suit your strategy.
Ensure that the RR labels are colored (blue or red) to indicate positive EV setups before executing trades.
For Advanced Traders:
1. Select Higher Timeframe Bias: Choose a higher timeframe (HTF) as your main bias. Start with the default pivot level and ensure the confidence level is above 95% to validate the probabilities.
2. Align Lower Timeframes: Switch between lower timeframes to identify which ones align with your predefined HTF bias. This helps in synchronizing your trading decisions across different timeframes.
3. Set Entries with Current Pivot Level: Use the current pivot level for trade entries. Ensure the HTF status label is active, indicating that the probabilities are valid and in play.
4. Target HTF Liquidity Level: Aim for liquidity levels that correspond to the higher timeframe, as these levels are likely to offer better trading opportunities.
5. Adjust Pivot Levels: As you gain experience, adjust the pivot levels to further optimize your strategy for high EV. Fine-tune these levels based on the aggregated data from multiple timeframes.
6. Practice on Paper Trading: Test your strategies through paper trading to eliminate discretion and refine your approach without financial risk.
7. Focus on Trade Management: Ultimately, effective trade management is crucial. Concentrate on managing your trades well to ensure long-term success. By aiming for setups that produce positive EV, you can position yourself similarly to how a casino operates.
----
🎲 Becoming the House (Gaining Edge Over the Market):
In American roulette, the house has a 5.26% edge due to the 0 and 00. This means that while players have a 47.37% chance of winning on even-money bets, the true odds are 50%. The discrepancy between the true odds and the payout ensures that, statistically, the casino will win over time.
From the Trader's Perspective: In trading, you gain an edge by focusing on setups with positive expected value (EV). If you have a 55.48% chance of winning with a 1:1 risk-to-reward ratio, your setup has a higher probability of profitability than the losing side. By consistently targeting such setups and managing your trades effectively, you create a statistical advantage, similar to the casino’s edge.
----
🎰 Applying the Concept to Trading:
Just as casinos rely on their mathematical edge, you can achieve long-term success in trading by focusing on setups with positive EV. By ensuring that your probabilities and risk-to-reward (RR) ratios are in your favor, you create an edge similar to that of the house.
And by systematically targeting trades with favorable probabilities and managing your trades effectively, you improve your chances of profitability over the long run. Which is going to help you “become the house” in your trading, leveraging statistical advantages to enhance your overall performance.
----
What makes this indicator original?
Real-Time Probability Calculations: The indicator provides real-time calculations of buy and sell probabilities based on historical data, allowing traders to assess the likelihood of positive expected value (EV) setups instantly.
Adjustable Pivot Levels: It features an adjustable pivot level that traders can modify according to their preferences, enhancing the flexibility to align with different trading strategies.
Multi-Timeframe Integration: The indicator supports up to 7 higher timeframes, displaying their probabilities and biases in a single view, which helps traders make informed decisions without switching timeframes.
Confidence Levels: It includes confidence levels based on sample sizes, offering insights into the reliability of the probabilities. Traders can gauge the strength of the data before making trades.
Dynamic EV Labels: The indicator provides color-coded EV labels that change based on the validity of the setup. Blue indicates positive EV in a long bias, red indicates positive EV in a short bias and gray signals caution, making it easier for traders to identify high-quality setups.
HTF Probability Table: The HTF probability table displays buy and sell probabilities from user-defined higher timeframes, helping traders integrate broader market context into their decision-making process.
----
Terms and Conditions | Disclaimer
Our charting tools are provided for informational and educational purposes only and should not be construed as financial, investment, or trading advice. They are not intended to forecast market movements or offer specific recommendations. Users should understand that past performance does not guarantee future results and should not base financial decisions solely on historical data.
Built-in components, features, and functionalities of our charting tools are the intellectual property of @Fractalyst use, reproduction, or distribution of these proprietary elements is prohibited.
By continuing to use our charting tools, the user acknowledges and accepts the Terms and Conditions outlined in this legal disclaimer and agrees to respect our intellectual property rights and comply with all applicable laws and regulations.

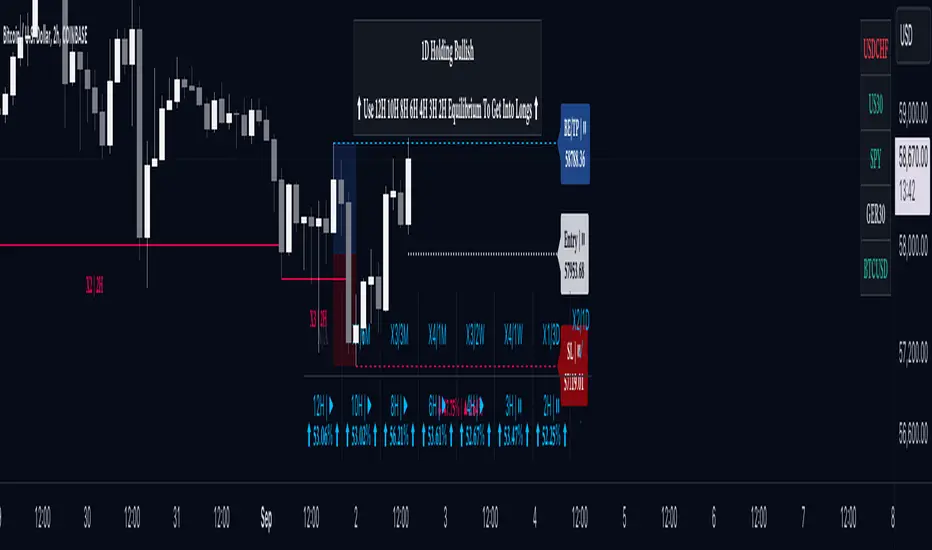
Screener | FractalystWhat’s the purpose of this indicator?
This indicator is part of the Optirange suite , which analyzes all timeframes using a mechanical top-down approach to determine the overall market bias. It helps you identify the specific timeframes and exact levels for positioning in longs, shorts, or guiding you on whether to stay away from trading a particular market condition.
The purpose of the Screener indicator is to track the contextual bias of multiple markets simultaneously on the charts without the need to switch between pairs. This allows traders to monitor various assets in real-time, enhancing decision-making efficiency and identifying potential trading opportunities more effectively.
-----
How does this indicator identify the overall market bias?
This indicator employs a systematic top-down approach, analyzing market structure, fractal blocks, and their mitigations from the 12M timeframe down to the 1D timeframe to uncover the story behind the market. This method helps identify the overall market bias, whether it’s bullish, bearish, or in consolidating conditions.
Below is a flowchart that illustrates the calculation behind the market context identification, demonstrating the systematic approach:
-----
According to the above trade plan, why do we only look for mitigations within Fractal Blocks of X1/X2?
In this context, "X" stands for a break in the market's structure, and the numbers (1 and 2) indicate the sequence of these breaks within the same trend direction, either up or down.
We focus on mitigations within Fractal Blocks during the X1/X2 stages because these points mark the early phase (X1) and the continuation (X2) of a trend. By doing so, we align our trades with the market's main direction and avoid getting stopped out in the middle of trends.
-----
How does this indicator identify ranges in a mechanical way?
Since the indicator is part of the Optirange suite , it follows the exact rules that Optirange utilizes to identify breaks of market structures in a mechanical manner.
Let’s take a closer look at how the ranges are calculated:
1- First, we need to understand the importance of following a set of mechanical rules in identifying market structure:
The image above illustrates the difference between a subjective and a mechanical approach to analyzing market structure. The subjective method often leads to uncertainty, where traders might struggle to pinpoint exact breaks in structure, resulting in inconsistent decision-making. Questions like “Is this a break?” or “Maybe this one...?” reflect the ambiguity of manual interpretation, which can cause confusion and errors in trading.
On the other hand, the mechanical approach depicted on the right side of the image follows a clear, rule-based method to define breaks in market structure. This systematic approach eliminates guesswork by providing precise criteria for identifying structural changes, such as marking structural invalidation levels where market bias shifts from bullish to bearish or vice versa. The mechanical method not only offers consistency but also integrates statistical probabilities , enhancing the trader's ability to make data-driven decisions.
By adhering to these mechanical rules, the Screener indicator ensures that ranges are identified consistently, allowing traders to rely on objective analysis rather than subjective interpretation . This approach is crucial for accurately defining market structures and making informed trading decisions.
2- Now let's take a look at a practical example of how the indicator utilizes Pivot points with a period of 2 to identify ranges:
In this image, we see a Bearish Scenario on the left and a Bullish Scenario on the right. The indicator starts by identifying the first significant swing on the chart. It then validates this swing by checking if there is a preceding swing high (for a bearish scenario) or swing low (for a bullish scenario). Once validated, the indicator confirms a break of structure when price closes below or above these points, respectively.
For instance, in the Bearish Scenario:
The first significant swing is identified.
The script checks for a preceding swing high before confirming any structural break.
A candle closure below the swing low confirms the first bearish break of structure.
This results in a confirmed market bias towards bearishness, with structural liquidity levels indicated for potential price targets.
In the Bullish Scenario:
The process is mirrored, identifying the first swing low and validating it with a preceding swing low.
A closure above this swing confirms the bullish break of structure.
This leads to a market bias towards bullishness, with invalidation levels to watch if the trend shifts.
This practical example demonstrates how the indicator systematically identifies market ranges, ensuring that traders can make informed decisions based on clear, rule-based criteria.
-----
How does this indicator identify ranges in a mechanical way, What are the underlying calculations?
Fractal blocks refer to the most extreme swing candle within the latest break. They can serve as significant levels for price rejection and may guide movements toward the next break, often in confluence with topdown analysis for added confirmation.
-----
What are mitigations, What are the underlying calculations?
Mitigations refer to specific price action occurrences identified by the script:
1- When the price reaches the most recent fractal block and confirms a swing candle, the script automatically draws a line from the swing to the fractal block bar and labels it with a checkmark.
2- If the price wicks through the invalidation level and then retraces back to the fractal block while forming a swing candle, the script labels this as a double mitigation on the chart.
This level will serve as the next potential invalidation level if a break occurs in the same direction.
-----
What does the right table display?
The table located at the right of your chart displays five colored symbols that represent the contextual market bias:
Green: The market is in a bullish condition.
Red: The market is in a bearish condition.
White: The market condition is uncertain, and it is advisable to stay away from trading.
-----
What does the bottom table display?
The bottom table can be turned on in the Optirange indicator and serves multiple purposes:
Range Counts and Mitigations: It shows the range counts and their mitigations across multiple timeframes, providing a comprehensive view of market dynamics.
Hourly Timeframe Probabilities: The bottom row of the bias table displays the probabilities for various hourly timeframes, helping to identify potential entry levels based on the multi-timeframe bias determined by the Screener.
In a bullish market context, you should look for long positions by focusing on hourly timeframes where buy-side probability exceeds 50%.
In a bearish market context, you should look for short positions by focusing on hourly timeframes where the sell-side probability exceeds 50%.
When the symbol is white within the Screener table, it signals that the market bias is unclear, and it's recommended to stay away from trading in such conditions.
-----
How the range probabilities are calculated?
Each break of market structure, denoted as X, is assigned a unique ID, starting from X1 for the first break, X2 for the second, and so on.
The probabilities are calculated based on breaks holding, meaning price closing through the liquidity level, rather than invalidation. This probability is then divided by the total count of similar numeric breaks.
For example, if 75 out of 100 bullish X1s become X2, then the probability of X1 becoming X2 on your charts will be displayed as 75% in the following format: ⬆ 75%
-----
What does the top table display?
The top table on the charts displays the current market context, offering insights into the underlying bias. It highlights the high-timeframe (HTF) bias and guides you on which timeframes you should use to enter long or short positions, based on the probability of success.
Additionally, when the market bias is unclear, the table clearly signals that it's best to avoid trading that specific market until the context or market story becomes clearer. This helps traders make informed decisions and avoid uncertain market conditions.
-----
How does the Screener indicator identify the market bias/context/story ?
- Market Structure: The Optirange indicator analyzes market structure across multiple timeframes, from a top-down perspective, including 12M, 6M, 3M, 1M, 2W, 1W, 3D, and 1D.
- Fractal Blocks: Once the market structure or current range is identified, the indicator automatically identifies the last push before the break and draws it as a box. These zones acts as a key area where the price often rejects from.
- Mitigations: After identifying the Fractal Block, the indicator checks for price mitigation or rejection within this zone. If mitigation occurs, meaning the price has reacted or rejected from the Fractal Block, the indicator draws a checkmark from the deepest candle within the Fractal Block to the initial candle that has created the zone.
- Bias Table: After identifying the three key elements—market structure, Fractal Blocks, and price mitigations—the indicator compiles this information into a multi-timeframe table. This table provides a comprehensive top-down perspective, showing what is happening from a structural standpoint across all timeframes. The Bias Table presents raw data, including identified Fractal Blocks and mitigations, to help traders understand the overall market trend. This data is crucial for the screener, which uses it to determine the current market bias based on a top-down analysis.
- Screener: Once all higher timeframes (HTF) and lower timeframes (LTF) are calculated using the indicator, it follows the exact rules outlined in the flowchart to determine the market bias. This systematic approach not only helps identify the current market trend but also suggests the exact timeframes to use for finding entry, particularly on hourly timeframes.
Example:
12M Timeframe:
OANDA:EURUSD
6M Timeframe :
OANDA:EURUSD
3M Timeframe :
OANDA:EURUSD
1M Timeframe :
OANDA:EURUSD
2W Timeframe :
OANDA:EURUSD
1W Timeframe :
OANDA:EURUSD
-----
User-input settings and customizations
Terms and Conditions | Disclaimer
Our charting tools are provided for informational and educational purposes only and should not be construed as financial, investment, or trading advice. They are not intended to forecast market movements or offer specific recommendations. Users should understand that past performance does not guarantee future results and should not base financial decisions solely on historical data. By utilizing our charting tools, the buyer acknowledges that neither the seller nor the creator assumes responsibility for decisions made using the information provided. The buyer assumes full responsibility and liability for any actions taken and their consequences, including potential financial losses. Therefore, by purchasing these charting tools, the customer acknowledges that neither the seller nor the creator is liable for any unfavorable outcomes resulting from the development, sale, or use of the products.
The buyer is responsible for canceling their subscription if they no longer wish to continue at the full retail price. Our policy does not include reimbursement, refunds, or chargebacks once the Terms and Conditions are accepted before purchase.
By continuing to use our charting tools, the user acknowledges and accepts the Terms and Conditions outlined in this legal disclaimer.
Custom Supertrend Multi-Timeframe Indicator [Pineify]Supertrend Multi-Timeframe Indicator
Introduction
The Supertrend Multi-Timeframe Indicator is an advanced trading tool designed to help traders identify trend directions and potential buy/sell signals by combining Supertrend indicators from multiple timeframes. This script is original in its approach to integrating Supertrend calculations across different timeframes, providing a more comprehensive view of market trends.
Concepts and Calculations
The indicator utilizes the Supertrend algorithm, which is based on the Average True Range (ATR). The Supertrend is a popular tool for trend-following strategies, and this script enhances its capabilities by incorporating data from a larger timeframe.
Supertrend Factor: Determines the sensitivity of the Supertrend line.
ATR Length: Defines the period for calculating the Average True Range.
Larger Supertrend Factor and ATR Length: Applied to the larger timeframe for a broader trend perspective.
Larger Timeframe: The higher timeframe from which the secondary Supertrend data is sourced.
How It Works
The script calculates the Supertrend for the current timeframe using the specified factor and ATR length.
Simultaneously, it requests Supertrend data from a larger timeframe.
Buy and sell signals are generated based on crossovers and crossunders of the Supertrend lines from both timeframes.
Visual cues (up and down arrows) are plotted on the chart to indicate buy and sell signals.
Background colors change to reflect the trend direction: green for an uptrend and red for a downtrend.
Usage
Add the indicator to your TradingView chart.
Customize the Supertrend factors, ATR lengths, and larger timeframe according to your trading strategy.
Enable or disable buy and sell alerts as needed.
Monitor the chart for visual signals and background color changes to make informed trading decisions.
Note: The indicator is best used in conjunction with other technical analysis tools and should not be relied upon as the sole basis for trading decisions.
Conclusion
The Supertrend Multi-Timeframe Indicator offers a unique and powerful way to analyze market trends by leveraging the strengths of the Supertrend algorithm across multiple timeframes. Its customizable settings and clear visual signals make it a valuable addition to any trader's toolkit.

LTF Inducement Levels [QuantVue]Inducement refers to a market manipulation tactic where large institutions or "smart money" create price movements that induce or lure retail traders into taking positions that are ultimately unfavorable. This concept is based on the idea that the market is moved by institutional traders who have the power and capital to manipulate prices to their advantage.
Within a dominant trend, there are frequently movements that go against the prevailing direction. These opposing moves are often driven by liquidity hunting on lower time frames. The price will experience a bounce or rejection, then aim for a previous short-term high or low before resuming its movement in alignment with the longer-term trend. Inducement involves specifically targeting these short-term highs or lows, which are potential zones where stop-loss orders may be located.
The LTF Inducement Levels indicator is designed to identify and display potential lower time frame (LTF) inducement levels on your chart. This indicator helps traders recognize price points where market manipulation might occur without needing multiple charts open.
Once a lower time frame pivot has been crossed, the level is removed from the current chart.
Multi-Timeframe Analysis:
The indicator uses a lower timeframe (LTF) to identify pivot highs and pivot lows, providing a granular view of potential inducement levels.
Configurable Parameters:
Lower Timeframe (LTF): The user can select the lower timeframe for analysis.
Pivot Length: The length used for identifying pivots.
Number of Pivots to Show: Limits the number of pivots displayed on the chart to avoid clutter.
Dynamic Pivot Management:
The indicator dynamically manages the pivots, adding new ones and removing old ones based on the configured maximum number of pivots to show.
It creates lines and labels for each pivot, which are updated as new pivots are formed or crossed.
Inducement Levels:
Pivot Highs: Marked with red lines and labeled with the price value.
Pivot Lows: Marked with green lines and labeled with the price value.
Cross Detection:
The indicator checks if the current price has crossed any of the identified pivots.
Once a pivot is crossed, the corresponding line and label are deleted.
Give this indicator a BOOST and COMMENT your thoughts below!
We hope you enjoy.
Cheers!

MTF-Colored EMA Difference and Stochastic indicatorThis indicator combines two popular technical analysis tools: the Exponential Moving Average (EMA) and the Stochastic Oscillator, with the added flexibility of analyzing them across multiple time frames. It visually represents the difference between two EMAs and the crossover signals from the Stochastic Oscillator, providing a comprehensive view of the market conditions.
Components:
EMA Difference Histogram :
EMA Calculation : The indicator calculates two EMAs (EMA1 and EMA2) for the selected time frame.
EMA Difference : The difference between EMA1 and EMA2 is plotted as a 4 coloured histogram.
Stochastic Oscillato r:
Calculation : The %K and %D lines of the Stochastic Oscillator are calculated for the selected time frame.
Additional Confirmation via Colors :
Green: %K is above %D, indicating a bullish signal.
Red: %K is below %D, indicating a bearish signal.
Entry and Exit Strategies
Entry Strategy :
Bullish Entry :
Condition 1: The histogram is Dark green (indicating a strong upward trend).
Condition 2: The Stochastic colour is green (%K is above %D).
Bearish Entry :
Condition 1: The histogram is Dark Red (indicating a strong downward trend).
Condition 2: The Stochastic colour is red (%K is below %D).
Exit Strategy:
Bullish Exit:
Condition: The Stochastic colour turns red (%K crosses below %D).
Bearish Exit:
Condition: The Stochastic colour turns green (%K crosses above %D).
Additional Considerations:
Time Frame Selection : The chosen time frame for both the EMA and Stochastic calculations should align with the trader’s strategy (e.g., daily for swing trading, hourly for intraday trading).
Risk Management : Implement stop-loss orders to manage risk effectively. The stop-loss can be placed below the recent swing low for long positions and above the recent swing high for short positions.
Confirmation : Consider using this indicator in conjunction with other technical analysis tools to confirm signals and reduce the likelihood of false entries and exits.

[GYTS-Pro] Flux Composer🧬 Flux Composer (Professional Edition)
🌸 Confluence indicator in GoemonYae Trading System (GYTS) 🌸
The Flux Composer is a powerful tool in the GYTS suite that is designed to aggregate signals from multiple Signal Providers, apply advanced decaying functions, and offer customisable and advanced confluence mechanisms. This allows making informed decisions by considering the strength and agreement ("when all stars align") of various input signals.
🌸 --------- TABLE OF CONTENTS --------- 🌸
1️⃣ Main Highlights
2️⃣ Flux Composer’s Features
Multi Signal Provider support
Advanced decaying functions
Customisable Flux confluence mechanisms
Actionable trading experience
Filtering options
User-friendly experience
Upgrades compared to Community Edition
3️⃣ User Guide
Selecting Signal Providers
Connecting Signal Providers to the Flux Composer
Understanding the Flux
Tuning the decaying functions
Choosing Flux confluence mechanism
Choosing sensitivity
Utilising the filtering options
Interpreting the Flux for trading signals
4️⃣ Limitations
🌸 ------ 1️⃣ --- MAIN HIGHLIGHTS --- 1️⃣ ------ 🌸
- Signal aggregation : Combines signals from multiple different 📡 Signal Providers, each of which can be tuned and adjusted independently.
- Decaying function : Utilises advanced decaying functions to model the diminishing effect of signals over time, ensuring that recent signals have more weight. In addition to the decaying effect, the "quality" of the original signals (e.g. a "strong" GDM from WaveTrend 4D ) are accounted for as well.
- Flux confluence mechanism : The aggregation of all decaying functions form the "Flux", which is the core signal measurement of the Flux Composer. Multiple mechanisms are available for creating the Flux and effectively using it for actionable trading signals.
- Visualisation : Provides detailed visualisation options to help users understand and tune the contributions of individual Signal Providers and their decaying functions.
- Backtesting : The 🧬 Flux Composer is a core component of the TradingView suite of the 🌸 GoemonYae Trading System (GYTS) 🌸. It connects multiple 📡 Signal Providers, such as the WaveTrend 4D, and processes their signals to produce a unified "Flux". This Flux can then be used by the GYTS "🎼 Order Orchestrator" for backtesting and trade automation.
🌸 ------ 2️⃣ --- FLUX COMPOSER'S FEATURES --- 2️⃣ ------ 🌸
Let's delve into more details...
💮 1. Multi Signal Provider support
Using the name of the GYTS "🎼 Order Orchestrator" as an analogy: Imagine a symphony where each instrument plays its own unique part, contributing to the overall harmony. The Flux Composer operates similarly, integrating multiple Signal Providers to create a comprehensive and robust trading signal -- the "Flux". Currently, it supports up to four streams from the WaveTrend 4D's ’s Gradient Divergence Measure (GDM) and another four streams from the Quantile Median Cross (QMC). These can be either four "Professional Edition" Signal Providers or eight "Community Editions".
Note that the GDM includes 2 different continuous signals and the QMC 3 different continuous signals (from different frequencies). This means that the Community Edition can handle 2*2 + 2*3 = 10 different continuous signals and the Professional Edition as much as 20.
As GYTS evolves, more Signal Providers will be added; at the moment of releasing the Flux Composer, only WaveTrend 4D is publicly available.
💮 2. Advanced decaying functions
A trading signal can be relevant today, less relevant tomorrow, and irrelevant in a week's time. In other words, its relevance diminishes, or decays , over time. The Flux Composer utilises decaying functions that ensure that recent signals carry more weight, while older signals fade away. This is crucial for accurate signal processing. The intensity and decay settings allow for precise control, allowing emphasising certain signals based on their strength and relevance over time. On top of that, unlike binary signals ("buy now"), the Flux Composer utilises the actual values from the Signal Providers, differentiating between the exact quality of signals, and thus offering a detailed representation of the trading landscape. We will illustrate this in a further section.
💮 3. Customisable Flux confluence mechanisms
Another core component of the Flux Composer is the ability of intelligently combining the decaying functions. It offers four sophisticated confluence mechanisms: Amplitude Compression, Accentuated Amplitude Compression, Trigonometric, and GYTSynthesis. Each mechanism has its unique way of processing the Flux, tailored to different trading needs. For instance, the Amplitude Compression method scales the Flux based on recent values, much like the Stochastic Oscillator, while the Trigonometric method uses smooth functions to reduce outliers’ impact. The GYTSynthesis is a proprietary method, striking a balance between signal strength and discriminative power.
We'll discuss this in more detail in the User Guide section.
💮 4. Actionable trading experience
While the mathematical abilities might seem overwhelming, the goal of the Flux Composer is to transform complex signal data into actionable trading signals. When the Flux reaches certain thresholds, it generates clear bullish or bearish signals, making it easy for traders to interpret. The inclusion of upper and lower thresholds (UT and LT) helps in identifying strong signals visually and should be a familiar behaviour similar to how many other indicators operate. Furthermore, the Flux Composer can plot trading signals directly on the oscillator, showing triangle shapes for buy or sell signals. This visual aid is complemented by the possibility to setup TradingView alerts.
💮 5. Filtering options
The Professional Edition also offers filtering options to possibly further improve the quality of Flux signals. Signal streams can be divided into “Signal Flux” and “Filter Flux.” The Filter Flux acts as a gatekeeper, ensuring that only signals meeting the Filter's criteria (which consist of similar UT/LT thresholds) are considered for trading. This dual-layer approach enhances the reliability of trading signals, reducing the chances of false positives.
💮 6. User-friendly experience
GYTS is all about sophisticated, robust methods but also "elegance". One of the interpretations of the latter, is that the users' experience is very important. Despite the Flux Composer's mathematical underpinnings, it offers intuitive settings that with omprehensive tooltips to help with a smooth setup process. For those looking to fine-tune their signals, the Flux Composer allows the visualisation of individual decaying functions. This feature helps users understand the impact of each setting and make informed adjustments. Additionally, the background of the chart can be coloured to indicate the trading direction suggested by the Filter Flux, providing an at-a-glance overview of market conditions.
💮 7. Upgrades compared to Community Edition
Number of signal streams -- At the moment of writing, the Professional Edition works with 4x GDM and 4x QMC signal streams from WaveTrend 4D Signal Provider , while Community Edition (CE) Flux Composer (FC) only works with 2x GDM and 2x QMC signal streams.
Flux confluence mechanism -- CE includes the Amplitude Compression and Trigonometric confluence mechanisms, while the Pro Edition also includes the Accentuated Amplitude Compression and the GYTSynthesis mechanisms.
Signal streams as filters -- The Pro Edition can use Signal Providers as filters.
🌸 ------ 3️⃣ --- USER GUIDE --- 3️⃣ ------ 🌸
💮 1. Selecting Signal Providers
The Flux Composer’s foundation lies in its Signal Providers. When starting with the Flux Composer, using a single Signal Provider can already provide significant value due to the nature of decaying functions. For instance, the WaveTrend 4D signal provider includes up to 5 signal types (GDM and QMC in different frequencies) in a single direction (long/short). Moreover, the various confluence mechanisms that enhance the resulting Flux result in improved discrimination between weak and strong signals. This approach is akin to ensemble learning in machine learning, where multiple models are combined to improve predictive performance.
While using a single Signal Provider is beneficial, the true power of the Flux Composer is realised with multiple Signal Providers. Here are two general approaches to selecting Signal Providers:
Diverse Behaviours
Use Signal Providers with different behaviours, such as WaveTrend 4D on various assets/timeframes or entirely different Signal Providers. This approach leverages diversification to achieve robustness, rooted in the principle that varied sources enhance the overall signal quality. To explain this with an analogy, this strategy aligns with the theory of diversification in portfolio management, where combining uncorrelated assets reduces overall risk. Similarly, combining uncorrelated signals can mitigate the risk of signal failure. A practical example can be integrating a mean-reversion signal with a trend-following signal -- these can balance each other out, providing more stable outputs over different market conditions.
Enhancing a Single Provider
If you consider a particular Signal Provider highly effective, you could improve its robustness by using multiple instances with slight variations. These variations could include different sources (e.g., close, HL2, HLC3), data providers (same asset across different brokers/exchanges), or parameter adjustments. This method mirrors Monte Carlo simulations, often used in risk management and derivative pricing, which involve running many simulations with varied inputs to estimate the probability of different outcomes. By applying similar principles, the strategy becomes less susceptible to overfitting, ensuring the signals are not overly dependent on specific data conditions.
💮 2. Connecting Signal Providers to the Flux Composer
Moving on to practicalities: how do you connect Signal Providers with the Flux Composer? You may have noticed that when you open the drawdown of a data source in a TradingView indicator (with "open", "high", "low", etc.), you also see names from other indicators on your chart. We call these "streams", and the Signal Providers are designed such that they output this stream in a way that the Flux Composer can interpret it. Thus, to connect a Signal Provider with the Flux Composer, you should first have that Signal Provider on your chart. Obviously you should set it up an a way that it seems to provide good signals. After that, in the Data Stream dropdown in the Flux Composer, you can select the stream that is outputted by your Signal Provider. This will always be with a prefix of "🔗 STREAM" (after the Signal Provider's indicator name). See the chart below.
There is one important nuance: when you have multiple (similar) Signal Providers on your chart, it may be hard to select the correct data stream in the Flux Composer as the names of the streams keep repeating when you use identical indicators. So be sure to be attentive as you might end up using the same signals multiple times.
Also, the Signal Providers have an "Indicator name" parameter (and another parameter to repeat this name) that is handy to use when you have multiple Signal Providers on your screen. It is handy to give names that describe the unique settings of that Signal Provider so you can better differentiate what you are looking at on your screen.
💮 3. Understanding the Flux
Let's understand how the Signal Provider's signals are processed. In the chart below, you see we have one Signal Provider (WaveTrend 4D) connected to the Flux Composer and that it gives a bearish QMC signal. The Flux Composer converts this into a decaying function. You can show these functions per Signal Provider when the option "Show decaying function of Signal Provider" is enabled (as it is in the chart).
In our opinion, of crucial importance is the ability to process the quality of signals, rather than just any signal. In mathematical terms, we are interested in continuous signals as these provide a spectrum of values. These signals can reflect varying degrees of market sentiment or trend strength, offering richer information than binary signals, which offer only two states (e.g., buy/sell). Especially in the context of the Flux Composer, where you aggregate multiple signals, it makes a big difference whether you combine 10 weak signals or 10 strong signals. To illustrate this principle, look at the chart below where there are 4 signals of different strengths. As you can see, each of the signals affects the Flux with different intensities.
💮 4. Tuning the decaying functions
As previously mentioned, the decaying functions are a way to give more importance to recent signals while allowing older ones to fade away gradually. This mimics the natural way we assess information, giving more weight to recent events. The decaying functions in the Flux Composer are highly customisable while remaining easy to use. You can adjust the initial intensity , which sets the starting strength of a signal, and the decay rate, which determines how quickly this signal diminishes over time. Let's look at specific examples.
If we add 3 Flux Composers on the chart, connect the same Signal Provider, keep all settings the same with one exception, we get the chart below. Here we have changed the "intensity" parameter of the specific signal. As you can see, the decaying functions are different. The intensity determines the initial strength of the decayed function. Adjusting the intensity allows you to emphasise certain signal types based on their perceived reliability or importance.
Let's now keep the intensity the same ("normal"), but change the "decay" parameter. As you can see in the image below, the decay controls how quickly the signal’s strength diminishes over time. By adjusting the decay, you can model the longevity of the signal’s impact. A faster decay means the signal loses its influence quickly, while a slower decay means it remains relevant for a longer period.
So how do multiple signals interact? You can see this as a simple "stacking of decaying functions" (although there is more to it, see next section). In the chart below we different strenghts of signals and different decay rates to illustrate how the Flux is constructed.
Hopefully this helps with developing some intuition how signals are converted to decaying functions, how you can control them, and how the Flux is constructed. When tuning these parameters, use the visualisation options to see how individual decaying functions contribute to the overall Flux. This helps in understanding and refining the parameters to achieve the desired trading signal behaviour.
💮 5. Choosing Flux confluence mechanism
While we mentioned that the Flux is a "stacking of individual decaying functions", in the back-end, that is not exactly that simple. Like previously mentioned, for GYTS, "elegance" is very important. One of the interpretations is "user friendliness" and the Flux confluence mechanism is one of the essential developments for this characteristic. The Flux confluence mechanism is critical in synthesising the aggregated signals into the Flux. The choice of mechanism affects how the signals are combined and the resulting trading signals. The Professional Edition offers four distinct mechanisms, each with its strengths.
The Amplitude Compression mechanism is intuitive, scaling the Flux based on recent values, intuitively not unlike the method of the well-known Stochastic Oscillator. The Accentuated Amplitude Compression method takes this a step further, giving more weight to strong Flux values. The Trigonometric mechanism smooths the Flux and reduces the impact of outliers, providing a balanced approach. Finally, the GYTSynthesis mechanism, a proprietary approach, balances signal strength and discriminative power, making it easier to tune and generalise.
It's difficult to convey the workings of the Flux confluence mechanism in a chart, but let's take the opportunity to show how the Flux would look like when connecting both one WaveTrend 4D Signal Provider signals to four Flux Composers with default settings, except the Flux confluence mechanism:
You may notice subtle differences between the four methods. They react differently to different values and their overall shape is slightly be different. The Amplitude Compression is more "pointy" and GYTSynthesis doesn't react to low values. There are many nuances, especially in combination with tuning the sensitivity and upper/lower threshold (UT/LT) parameters.
💮 6. Choosing sensitivity
Speaking of the sensitivity , this parameters fine-tunes how responsive the Flux is to the input signals. Higher sensitivity results in more pronounced responses, leading to more frequent trading signals. Lower sensitivity makes the Flux less responsive, resulting in fewer but potentially more reliable signals.
You might think that changing the upper/lower threshold (UT/LT) parameters would be equivalent, but that's not the case. The sensitivity In case of the Amplitude Compression mechanisms, changing the sensitivity would change the relative Flux shape over time, and with the Trigonometric and GYTSynthesis mechanisms, the Flux shape itself (independent of time) would change. In other words, these are all good parameters for tuning.
💮 7. Utilising the filtering options
When choosing the signal stream of a Signal Provider, you can also change the default "Signal" category of that Signal Provider to a "Filter". In the example below, two Signal Providers are connected; the second is set as a filter. You can see that a second row of a Flux is shown in the Flux Composer (this visualisation can be disabled), corresponding with the signals of the second Signal Provider.
Logically, only when the Filter Flux gives a signal in a certain direction, signals from the regular Signal Flux are registered. Generally speaking, for this use case it is handy to set the thresholds for the Filter Flux low and possibly to decrease the decay rate so that the filtering is active for a long enough time.
💮 8. Interpreting the Flux for trading signals
Lastly, the Signal Flux gives buy and sell signals when it crosses the upper/lower thresholds (UT/LT), when the filter allows it (if enabled). This can be visualised with the triangles as you may have seen in the charts in the previous sections. For people using TradingView's alerts -- these would work too out of the box. And finally, for backtesting and possibly trade automation, we will have the GYTS "🎼 Order Orchestrator" that connects with the Flux Composer.
🌸 ------ 4️⃣ --- LIMITATIONS --- 4️⃣ ------ 🌸
Only 🌸 GYTS 📡 Signal Providers are supported, as there is a specific method to pass continuous (non-binary) data in the data stream
At the moment of release, only the WaveTrend 4D Signal Provider is available. Other Signal Providers will be gradually released.

[GYTS-CE] Flux Composer🧬 Flux Composer (Community Edition)
🌸 Confluence indicator in GoemonYae Trading System (GYTS) 🌸
The Flux Composer is a powerful tool in the GYTS suite that is designed to aggregate signals from multiple Signal Providers, apply customisable decaying functions, and offer customisable and advanced confluence mechanisms. This allows making informed decisions by considering the strength and agreement ("when all stars align") of various input signals.
🌸 --------- TABLE OF CONTENTS --------- 🌸
1️⃣ Main Highlights
2️⃣ Flux Composer’s Features
Multi Signal Provider support
Advanced decaying functions
Customisable Flux confluence mechanisms
Actionable trading experience
User-friendly experience
3️⃣ User Guide
Selecting Signal Providers
Connecting Signal Providers to the Flux Composer
Understanding the Flux
Tuning the decaying functions
Choosing Flux confluence mechanism
Choosing sensitivity
Interpreting the Flux for trading signals
4️⃣ Limitations
🌸 ------ 1️⃣ --- MAIN HIGHLIGHTS --- 1️⃣ ------ 🌸
- Signal aggregation : Combines signals from multiple different 📡 Signal Providers, each of which can be tuned and adjusted independently.
- Decaying function : Utilises advanced decaying functions to model the diminishing effect of signals over time, ensuring that recent signals have more weight. In addition to the decaying effect, the "quality" of the original signals (e.g. a "strong" GDM from WaveTrend 4D with GDM ) are accounted for as well.
- Flux confluence mechanism : The aggregation of all decaying functions form the "Flux", which is the core signal measurement of the Flux Composer. Multiple mechanisms are available for creating the Flux and effectively using it for actionable trading signals.
- Visualisation : Provides detailed visualisation options to help users understand and tune the contributions of individual Signal Providers and their decaying functions.
- Backtesting : The 🧬 Flux Composer is a core component of the TradingView suite of the 🌸 GoemonYae Trading System (GYTS) 🌸. It connects multiple 📡 Signal Providers, such as the WaveTrend 4D, and processes their signals to produce a unified "Flux". This Flux can then be used by the GYTS "🎼 Order Orchestrator" for backtesting and trade automation.
🌸 ------ 2️⃣ --- FLUX COMPOSER'S FEATURES --- 2️⃣ ------ 🌸
Let's delve into more details...
💮 1. Multi Signal Provider support
Using the name of the GYTS "🎼 Order Orchestrator" as an analogy: Imagine a symphony where each instrument plays its own unique part, contributing to the overall harmony. The Flux Composer operates similarly, integrating multiple Signal Providers to create a comprehensive and robust trading signal -- the "Flux". Currently, it supports up to two streams from the WaveTrend 4D’s Gradient Divergence Measure (GDM) and another two streams from the WaveTrend 4D's Quantile Median Cross (QMC) .
Note that the GDM includes 2 different continuous signals and the QMC 3 different continuous signals (from different frequencies). This means that the Community Edition can handle 2*2 + 2*3 = 10 different continuous signals.
As GYTS evolves, more Signal Providers will be added; at the moment of releasing the Flux Composer, only WaveTrend 4D with GDM and with QMC are publicly available.
💮 2. Advanced decaying functions
A trading signal can be relevant today, less relevant tomorrow, and irrelevant in a week's time. In other words, its relevance diminishes, or decays , over time. The Flux Composer utilises decaying functions that ensure that recent signals carry more weight, while older signals fade away. This is crucial for accurate signal processing. The intensity and decay settings allow for precise control, allowing emphasising certain signals based on their strength and relevance over time. On top of that, unlike binary signals ("buy now"), the Flux Composer utilises the actual values from the Signal Providers, differentiating between the exact quality of signals, and thus offering a detailed representation of the trading landscape. We will illustrate this in a further section.
💮 3. Customisable Flux confluence mechanisms
Another core component of the Flux Composer is the ability of intelligently combining the decaying functions. It offers two sophisticated confluence mechanisms: Amplitude Compression and Trigonometric. Each mechanism has its unique way of processing the Flux, tailored to different trading needs. The Amplitude Compression method scales the Flux based on recent values, much like the Stochastic Oscillator, while the Trigonometric method uses smooth functions to reduce outliers’ impact We'll discuss this in more detail in the User Guide section.
💮 4. Actionable trading experience
While the mathematical abilities might seem overwhelming, the goal of the Flux Composer is to transform complex signal data into actionable trading signals. When the Flux reaches certain thresholds, it generates clear bullish or bearish signals, making it easy for traders to interpret. The inclusion of upper and lower thresholds (UT and LT) helps in identifying strong signals visually and should be a familiar behaviour similar to how many other indicators operate. Furthermore, the Flux Composer can plot trading signals directly on the oscillator, showing triangle shapes for buy or sell signals. This visual aid is complemented by the possibility to setup TradingView alerts.
💮 5. User-friendly experience
GYTS is all about sophisticated, robust methods but also "elegance". One of the interpretations of the latter, is that the users' experience is very important. Despite the Flux Composer's mathematical underpinnings, it offers intuitive settings that with omprehensive tooltips to help with a smooth setup process. For those looking to fine-tune their signals, the Flux Composer allows the visualisation of individual decaying functions. This feature helps users understand the impact of each setting and make informed adjustments.
🌸 ------ 3️⃣ --- USER GUIDE --- 3️⃣ ------ 🌸
💮 1. Selecting Signal Providers
The Flux Composer’s foundation lies in its Signal Providers. When starting with the Flux Composer, using a single Signal Provider can already provide significant value due to the nature of decaying functions. For instance, the WaveTrend 4D signal provider includes up to two GDM and three QMC signals in a single direction (long/short). Moreover, the various confluence mechanisms that enhance the resulting Flux result in improved discrimination between weak and strong signals. This approach is akin to ensemble learning in machine learning, where multiple models are combined to improve predictive performance.
While using a single Signal Provider is beneficial, the true power of the Flux Composer is realised with multiple Signal Providers. Here are two general approaches to selecting Signal Providers:
Diverse Behaviours
Use Signal Providers with different behaviours, such as WaveTrend 4D on various assets/timeframes or entirely different Signal Providers. This approach leverages diversification to achieve robustness, rooted in the principle that varied sources enhance the overall signal quality. To explain this with an analogy, this strategy aligns with the theory of diversification in portfolio management, where combining uncorrelated assets reduces overall risk. Similarly, combining uncorrelated signals can mitigate the risk of signal failure. A practical example can be integrating a mean-reversion signal with a trend-following signal -- these can balance each other out, providing more stable outputs over different market conditions.
Enhancing a Single Provider
If you consider a particular Signal Provider highly effective, you could improve its robustness by using multiple instances with slight variations. These variations could include different sources (e.g., close, HL2, HLC3), data providers (same asset across different brokers/exchanges), or parameter adjustments. This method mirrors Monte Carlo simulations, often used in risk management and derivative pricing, which involve running many simulations with varied inputs to estimate the probability of different outcomes. By applying similar principles, the strategy becomes less susceptible to overfitting, ensuring the signals are not overly dependent on specific data conditions.
💮 2. Connecting Signal Providers to the Flux Composer
Moving on to practicalities: how do you connect Signal Providers with the Flux Composer? You may have noticed that when you open the drawdown of a data source in a TradingView indicator (with "open", "high", "low", etc.), you also see names from other indicators on your chart. We call these "streams", and the Signal Providers are designed such that they output this stream in a way that the Flux Composer can interpret it. Thus, to connect a Signal Provider with the Flux Composer, you should first have that Signal Provider on your chart. Obviously you should set it up an a way that it seems to provide good signals. After that, in the Data Stream dropdown in the Flux Composer, you can select the stream that is outputted by your Signal Provider. This will always be with a prefix of "🔗 STREAM" (after the Signal Provider's indicator name). See the chart below.
There is one important nuance: when you have multiple (similar) Signal Providers on your chart, it may be hard to select the correct data stream in the Flux Composer as the names of the streams keep repeating when you use identical indicators. So be sure to be attentive as you might end up using the same signals multiple times.
Also, the Signal Providers have an "Indicator name" parameter (and another parameter to repeat this name) that is handy to use when you have multiple Signal Providers on your screen. It is handy to give names that describe the unique settings of that Signal Provider so you can better differentiate what you are looking at on your screen.
💮 3. Understanding the Flux
Let's understand how the Signal Provider's signals are processed. In the chart below, you see we have one Signal Provider (WaveTrend 4D) connected to the Flux Composer and that it gives a bearish QMC signal. The Flux Composer converts this into a decaying function. You can show these functions per Signal Provider when the option "Show decaying function of Signal Provider" is enabled (as it is in the chart).
In our opinion, of crucial importance is the ability to process the quality of signals, rather than just any signal. In mathematical terms, we are interested in continuous signals as these provide a spectrum of values. These signals can reflect varying degrees of market sentiment or trend strength, offering richer information than binary signals, which offer only two states (e.g., buy/sell). Especially in the context of the Flux Composer, where you aggregate multiple signals, it makes a big difference whether you combine 10 weak signals or 10 strong signals. To illustrate this principle, look at the chart below where there are 4 signals of different strengths. As you can see, each of the signals affects the Flux with different intensities.
💮 4. Tuning the decaying functions
As previously mentioned, the decaying functions are a way to give more importance to recent signals while allowing older ones to fade away gradually. This mimics the natural way we assess information, giving more weight to recent events. The decaying functions in the Flux Composer are highly customisable while remaining easy to use. You can adjust the initial intensity , which sets the starting strength of a signal, and the decay rate, which determines how quickly this signal diminishes over time. Let's look at specific examples.
If we add 3 Flux Composers on the chart, connect the same Signal Provider, keep all settings the same with one exception, we get the chart below. Here we have changed the "intensity" parameter of the specific signal. As you can see, the decaying functions are different. The intensity determines the initial strength of the decayed function. Adjusting the intensity allows you to emphasise certain signal types based on their perceived reliability or importance.
Let's now keep the intensity the same ("normal"), but change the "decay" parameter. As you can see in the image below, the decay controls how quickly the signal’s strength diminishes over time. By adjusting the decay, you can model the longevity of the signal’s impact. A faster decay means the signal loses its influence quickly, while a slower decay means it remains relevant for a longer period.
So how do multiple signals interact? You can see this as a simple "stacking of decaying functions" (although there is more to it, see next section). In the chart below we use different "intensity" and "decay" parameters to discuss how the Flux is created.
Hopefully this helps with developing some intuition how signals are converted to decaying functions, how you can control them, and how the Flux is constructed. When tuning these parameters, use the visualisation options to see how individual decaying functions contribute to the overall Flux. This helps in understanding and refining the parameters to achieve the desired trading signal behaviour.
💮 5. Choosing Flux confluence mechanism
While we mentioned that the Flux is a "stacking of individual decaying functions", in the back-end, that is not exactly that simple. Like previously mentioned, for GYTS, "elegance" is very important. One of the interpretations is "user friendliness" and the Flux confluence mechanism is one of the essential developments for this characteristic. The Flux confluence mechanism is critical in synthesising the aggregated signals into the Flux. The choice of mechanism affects how the signals are combined and the resulting trading signals. The Community Edition offers two distinct mechanisms, each with its strengths.
The Amplitude Compression mechanism is intuitive, scaling the Flux based on recent values, intuitively not unlike the method of the well-known Stochastic Oscillator. On the other hand, the Trigonometric mechanism smooths the Flux and reduces the impact of outliers, providing a balanced approach. It's difficult to convey the workings of the Flux confluence mechanism in a chart, but let's take the opportunity to show how the Flux would look like when connecting both GDM and QMC signals to two Flux Composers with default settings, except the Flux confluence mechanism:
You can notice that the upper Flux Converter (FC) triggered two signals while the other FC triggered only one. There are more nuances, especially in combination with tuning the sensitivity and upper/lower threshold (UT/LT) parameters.
💮 6. Choosing sensitivity
Speaking of the sensitivity , this parameters fine-tunes how responsive the Flux is to the input signals. Higher sensitivity results in more pronounced responses, leading to more frequent trading signals. Lower sensitivity makes the Flux less responsive, resulting in fewer but potentially more reliable signals.
You might think that changing the upper/lower threshold (UT/LT) parameters would be equivalent, but that's not the case. The sensitivity In case of the Amplitude Compression mechanism, changing the sensitivity would change the relative Flux shape over time, and with the Trigonometric mechanism, the Flux shape itself (independent of time) would change. In other words, these are all good parameters for tuning.
💮 8. Interpreting the Flux for trading signals
Lastly, the Signal Flux gives buy and sell signals when it crosses the upper/lower thresholds (UT/LT) This can be visualised with the triangles as you may have seen in the charts in the previous sections. For people using TradingView's alerts -- these would work out of the box. And finally, for backtesting and possibly trade automation, we will have the GYTS "🎼 Order Orchestrator" that connects with the Flux Composer.
🌸 ------ 4️⃣ --- LIMITATIONS --- 4️⃣ ------ 🌸
Only 🌸 GYTS 📡 Signal Providers are supported, as there is a specific method to pass continuous (non-binary) data in the data stream
At the moment of release, only WaveTrend 4D with GDM and with QMC are available. Other Signal Providers will be gradually released.

Market Sentiment Technicals [LuxAlgo]The Market Sentiment Technicals indicator synthesizes insights from diverse technical analysis techniques, including price action market structures, trend indicators, volatility indicators, momentum oscillators, and more.
The indicator consolidates the evaluated outputs from these techniques into a singular value and presents the combined data through an oscillator format, technical rating, and a histogram panel featuring the sentiment of each component alongside the overall sentiment.
🔶 USAGE
The Market Sentiment Technicals indicator is a tool able to swiftly and easily gauge market sentiment by consolidating the individual sentiment from multiple technical analysis techniques applied to market data into a single value, allowing users to asses if the market is uptrending, consolidating, or downtrending.
The tool includes various components and presentation formats, each described in the sub-sections below.
🔹Indicators Sentiment Panel
The indicators sentiment panel provides normalized sentiment scores for each supported indicator, along with a synthesized representation derived from the average of all individual normalized sentiments.
🔹Market Sentiment Meter
The market sentiment meter is obtained from the synthesized representation derived from the average of all individual normalized sentiments. It allows users to quickly and easily gauge the overall market sentiment.
🔹Market Sentiment Oscillator
The market sentiment oscillator provides a visual means to monitor the current and historical strength of the market. It assists in identifying the trend direction, trend momentum, and overbought and oversold conditions, aiding in the anticipation of potential trend reversals.
Divergence occurs when there is a difference between what the price action is indicating and what the market sentiment oscillator is indicating, helping traders assess changes in the price trend.
🔶 DETAILS
The indicator employs a range of technical analysis techniques to interpret market data. Each group of indicators provides valuable insights into different aspects of market behavior.
🔹Momentum Indicators
Momentum indicators assess the speed and change of price movements, often indicating whether a trend is strengthening or weakening.
Relative Strength Index (RSI): Measures the magnitude of recent price changes to evaluate overbought or oversold conditions.
Stochastic %K: Compares the closing price to the range over a specified period to identify potential reversal points.
Stochastic RSI Fast: Combines features of Stochastic oscillators and RSI to gauge both momentum and overbought/oversold levels efficiently.
Commodity Channel Index (CCI): Measures the deviation of an asset's price from its statistical average to determine trend strength and overbought and oversold conditions.
Bull Bear Power: Evaluates the strength of buying and selling pressure in the market.
🔹Trend Indicators
Trend indicators help traders identify the direction of a market trend.
Moving Averages: Provides a smoothed representation of the underlying price data, aiding in trend identification and analysis.
Bollinger Bands: Consists of a middle band (typically a simple moving average) and upper and lower bands, which represent volatility levels of the market.
Supertrend: A trailing stop able to identify the current direction of the trend.
Linear Regression: Fits a straight line to past data points to predict future price movements and identify trend direction.
🔹Market Structures
Market Structures: Analyzes the overall pattern of price movements, including Break of Structure (BOS), Market Structure Shifts (MSS), also referred to as Change of Character (CHoCH), aiding in identifying potential market turning and continuation points.
🔹The Normalization Technique
The normalization technique employed for trend indicators relies on buy-sell signals. The script tracks price movements and normalizes them based on these signals.
normalize(buy, sell, smooth)=>
var os = 0
var float max = na
var float min = na
os := buy ? 1 : sell ? -1 : os
max := os > os ? close : os < os ? max : math.max(close, max)
min := os < os ? close : os > os ? min : math.min(close, min)
ta.sma((close - min)/(max - min), smooth) * 100
In this Pine Script snippet:
The variable os tracks market sentiment, taking a value of 1 for buy signals and -1 for sell signals, indicating bullish and bearish sentiments, respectively.
max and min are used to identify extremes in sentiment and are updated based on changes in os . When market sentiment shifts from buying to selling (or vice versa), max and min adjust accordingly.
Normalization is achieved by comparing current price levels to historical extremes in sentiment. The result is smoothed by default using a 3-period simple moving average. Users have the option to customize the smoothing period via the script settings input menu.
🔶 SETTINGS
🔹Generic Settings
Timeframe: This option selects the timeframe for calculating sentiment. If a timeframe lower than the chart's is chosen, calculations will be based on the chart's timeframe.
Horizontal Offset: Determines the distance at which the visual components of the indicator will be displayed from the primary chart.
Gradient Colors: Allows customization of gradient colors.
🔹Indicators Sentiment Panel
Indicators Sentiment Panel: Toggle the visibility of the indicators sentiment panel.
Panel Height: Determines the height of the panel.
🔹Market Sentiment Meter
Market Sentiment Meter: Toggle the visibility of the market sentiment meter (technical ratings in the shape of a speedometer).
🔹Market Sentiment Oscillator
Market Sentiment Oscillator: Toggle the visibility of the market sentiment oscillator.
Show Divergence: Enables detection of divergences based on the selected option.
Oscillator Line Width: Customization option for the line width.
Oscillator Height: Determines the height of the oscillator.
🔹Settings for Individual Components
In general,
Source: Determines the data source for calculations.
Length: The period to be used in calculations.
Smoothing: Degree of smoothness of the evaluated values.
🔹Normalization Settings - Trend Indicators
Smoothing: The period used in smoothing normalized values, where normalization is applied to moving averages, Bollinger Bands, Supertrend, VWAP bands, and market structures.
🔶 LIMITATIONS
Like any technical analysis tool, the Market Sentiment Technicals indicator has limitations. It's based on historical data and patterns, which may not always accurately predict future market movements. Additionally, market sentiment can be influenced by various factors, including economic news, geopolitical events, and market psychology, which may not be fully captured by technical analysis alone.

Multi-Chart Widget [LuxAlgo]The Multi-Chart Widget tool is a comprehensive solution crafted for traders and investors looking to analyze multiple financial instruments simultaneously. With the capability to showcase up to three additional charts, users can customize each chart by selecting different financial instruments, and timeframes.
Users can add various widely used technical indicators to the charts such as the relative strength index, Supertrend, moving averages, Bollinger Bands...etc.
🔶 USAGE
The tool offers traders and investors a comprehensive view of multiple charts simultaneously. By displaying up to three additional charts alongside the primary chart, users can analyze assets across different timeframes, compare their performance, and make informed decisions.
Users have the flexibility to choose from various customizable chart types, including the recently added "Volume Candles" option.
This tool allows adding to the chart some of the most widely used technical indicators, such as the Supertrend, Bollinger Bands, and various moving averages.
In addition to the charting capabilities, the tool also features a dynamic statistic panel that provides essential metrics and key insights into the selected assets. Users can track performance indicators such as relative strength, trend, and volatility, enabling them to identify trends, patterns, and trading opportunities efficiently.
🔶 DETAILS
A brief overview of the indicators featured in the statistic panel is given in the sub-section below:
🔹Dual Supertrend
The Dual Supertrend is a modified version of the Supertrend indicator, which is based on the concept of trend following. It generates buy or sell signals by analyzing the asset's price movement. The Dual Supertrend incorporates two Supertrend indicators with different parameters to provide potentially more accurate signals. It helps traders identify trend reversals and establish trend direction in a more responsive manner compared to a single Supertrend.
🔹Relative Strength Index
The Relative Strength Index is a momentum oscillator that measures the speed and change of price movements. RSI oscillates between 0 and 100 and is typically used to identify overbought or oversold conditions in a market. Traditionally, RSI values above 70 are considered overbought, suggesting that the asset may be due for a reversal or correction, while RSI values below 30 are considered oversold, indicating potential buying opportunities.
🔹Volatility
Volatility in trading refers to the degree of variation or fluctuation in the price of a financial instrument, such as a stock, currency pair, or commodity, over a certain period of time. It is a measure of the speed and magnitude of price changes and reflects the level of uncertainty or risk in the market. High volatility implies that prices are experiencing rapid and significant movements, while low volatility suggests that prices are relatively stable and are not changing much. Traders often use volatility as an indicator to assess the potential risk and return of an investment and to make informed decisions about when to enter or exit trades.
🔹R-Squared (R²)
R-squared, also known as the coefficient of determination, is a statistical measure that indicates the proportion of the variance in the dependent variable that is predictable from the independent variable(s). In other words, it quantifies the goodness of fit of a regression model to the observed data. R-squared values range from %0 to %100, with higher values indicating a better fit of the model to the data. An R-squared of 100% means that all movements of a security are completely explained by movements in the index, while an R-squared value of %0 indicates that the model does not explain any of the variability in the dependent variable.
In simpler terms, in investing, a high R-squared, from 85% to 100%, indicates that the stock’s or fund’s performance moves relatively in line with the index. Conversely, a low R-squared (around 70% or less) indicates that the fund's performance tends to deviate significantly from the movements of the index.
🔶 SETTINGS
🔹Mini Chart(s) Generic Settings
Mini Charts Separator: This option toggles the visibility of the separator lines.
Number Of Bars: Specifies the number of bars to be displayed for each mini chart.
Horizontal Offset: Determines the distance at which the mini charts will be displayed from the primary chart.
🔹Mini Chart Settings: Top - Middle - Bottom
Mini Chart Top/Middle/Bottom: Toggle the visibility of the selected mini chart.
Symbol: Choose the financial instrument to be displayed in the mini chart. If left as an empty string, it will default to the current chart instrument.
Timeframe: This option determines the timeframe used for calculating the mini charts. If a timeframe lower than the chart's timeframe is selected, the calculations will be based on the chart's timeframe.
Chart Type: Selection from various chart types for the mini charts, including candles, volume candles, line, area, columns, high-low, and Heikin Ashi.
Chart Size: Determines the size of the mini chart.
Technical Indicator: Selection from various technical indicators to be displayed on top of the mini charts.
Note : Chart sizing is relative to other mini charts. For example, If all the mini charts are sized to x5 relative to each other, the result will be the same as if they were all sized as x1. This is because the relative proportions between the mini charts remain consistent regardless of their absolute sizes. Therefore, their positions and sizes relative to each other remain unchanged, resulting in the same visual representation despite the differences in absolute scale.
🔹Supertrend Settings
ATR Length: is the lookback length for the ATR calculation.
Factor: is what the ATR is multiplied by to offset the bands from price.
Color: color customization option.
🔹Moving Average Settings
Type: is the type of the moving average, available types of moving averages include SMA (Simple Moving Average), EMA (Exponential Moving Average), RMA (Root Mean Square Moving Average), HMA (Hull Moving Average), WMA (Weighted Moving Average), and VWMA (Volume Weighted Moving Average).
Source: Determines what data from each bar will be used in calculations.
Length: The time period to be used in calculating the Moving Average.
Color: Color customization option.
🔹Bollinger Bands Settings
Basis Type: Determines the type of Moving Average that is applied to the basis plot line.
Source: Determines what data from each bar will be used in calculations.
Length: The time period to be used in calculating the Moving Average which creates the base for the Upper and Lower Bands.
StdDev: The number of Standard Deviations away from the Moving Average that the Upper and Lower Bands should be.
Color: Color customization options for basis, upper and lower bands.
🔹Mini Chart(s) Panel Settings
Mini Chart(s) Panel: Controls the visibility of the panel containing the mini charts.
Dual Supertrend: Toggles the display of the evaluated dual super trend, based on the super trend settings provided below the option. The definitions for the options are the same as stated above for the super trend.
Relative Strength Index: Toggles the display of the evaluated RSI, based on the source and length settings provided below the option.
Volatility: Toggles the display of the calculated Volatility, based on the length settings provided below the option.
R-Squared: Toggles the display of the calculated R-Squared (R²), based on the length settings provided below the option.
🔶 LIMITATIONS
The tool allows users to display mini charts featuring various types of instruments alongside the primary chart instrument. However, there's a limitation: the selected primary chart instrument must have an ACTIVE market status. Alternatively, if the primary chart instrument is not active, the mini chart instruments must belong to the same exchange and have the same type as the primary chart instrument.

[GYTS-CE] Signal Provider | WaveTrend 4D with GDMWaveTrend 4D with Gradient Divergence Measure (Community Edition)
🌸 " 📡 Signal Provider" in GoemonYae Trading System (GYTS) 🌸
WaveTrend 4D (WT4D) is an extension of the incredible WaveTrend 3D (2022, Justin Dehorty) . This oscillator elevates the classic WaveTrend by integrating advanced mathematical models for a multi-dimensional view of market momentum, capturing subtle shifts and trends that traditional indicators might miss. Each oscillator layer uses a combination of normalised derivatives, hyperbolic tangent transformations, and dual-pole filtering (John Ehlers' SuperSmoother), providing normalised and smooth signals with minimised lag.
The name "WaveTrend 4D" is derived from the usage of 4 dimensions, representing different frequencies or timeframes. Next to the "fast", "normal" and "slow" frequency, the fourth frequency is called "lethargic" (very slow). This gives the opportunity utilise more dimensions without having abundant signals, since we quantify and filter the quality of signals.
WT4D strives to help discriminating high-quality signals from the indicator by introducing the Gradient Divergence Measure (GDM) and Quantile Median Crosses (QMC). For simplicity, speed and focus, this particular indicator includes only the GDM part. Check the other 🤲Community Edition of this indicator that focuses on the QMC. For GDM, see below for more information.
🌸 --- GRADIENT DIVERGENCE MEASURE (GDM) --- 🌸
💮 Introduction
--
The GDM dynamically calculates a composite measure based on multiple factors. Unlike traditional binary divergence indicators, GDM employs a continuous value system to capture the nuanced dynamics of market behaviour. This methodology allows traders and analysts to assess the potency of divergence signals with greater precision, facilitating more informed decision-making processes.
💮 Methodology
--
The GDM is calculated using a composite formula that integrates various market dynamics. At its core, it consists of six components listed below, each weighted to optimize the indicator's responsiveness to market conditions:
The magnitude of relative change between waves -- A larger difference between the waves, i.e. lower high or higher low could signify a stronger divergence.
The absolute value of the latest wave -- The strength of the latest wave provides insight into the extremity of the market conditions.
Slope of the divergence -- The slope between the two points of divergence essentially measures the rate of change in the frequency\'s value over time. It captures both the direction and the steepness of the indicator’s move between two waves.
The magnitude of relative change of the price -- A divergence means that the oscillator shows an opposite pattern than price action. Thus, if the price makes a significantly higher high or lower low, but the indicator does not, this discrepancy can be used to measure the divergence strength. This components measures the price's extrema during the crosses of the indicator's waves.
Higher timeframe's frequency trend -- Similarly, instead of looking at the price directly, this component measures the more general trend of the price by using the higher timeframe frequency (i.e. the slow frequency when looking at divergences of the normal frequency).
Time duration -- Lastly, the time duration between the two points of a divergence can also be an important factor. A divergence that spans over a longer period might indicate a more significant market sentiment shift.
💮 Tuning the GDM
--
The 6 components discussed above are not independent, e.g. the slope is actually the result of the magnitude between waves, the absolute value and time duration. However, the default GDM is carefully tuned to include all these features without being too sensitive to outliers.
This makes this indicator very user-friendly. The only core parameter is the the "sensitivity". This controls the extent of normalisation between signals, and essentially affects how often strong GDMs appear. At the conservative end (higher sensitivity), the strong GDMs are less frequent but are relatively significant, while with a lower sensitivity the strong GDMs appear more frequent.
💮 GDM on the Oscillator
--
The GDMs are represented by triangles and their value represents the strength. A value close to `1` signifies a strong bearish divergence and thus a possible reversal of continuation of a downtrend. Similarly, a value close to `-1` signifies a strong bullish divergence.
Note that there are two colour sets which can be enabled and disabled. One uses crosses between the fast and normal frequencies (with the slow frequency acting as the price trend with which there should be an opposite interaction -- hence a "divergence"). Similarly, crosses between the normal and slow frequencies (with the lethargic (the most slow) frequency acting as the price trend) are used to find divergences on a higher timeframe.
Another handy feature is a threshold to more strikingly visualise "strong" GDMs.
🌸 --- GOEMONYAE TRADING SYSTEM --- 🌸
As previously mentioned, this indicator is a 📡 Signal Provider, part of the suite of the GoemonYae Trading System (🤲 Community Edition). The greatest value comes from connecting multiple 📡 Signal Providers to the 🧬 Flux Composer to find confluence between signals. Contrary to most other indicators that connect with each other, the signals that are passed are not just binary signals ("buy" or "sell") but pass the actual GDM and QMC values. This gives the opportunity in the 🧬 Flux Composer to more accurately use multiple signals with different strengths to finally give an overall signal. On its turn, the Flux Composer can be connected to the GYTS "🎼 Order Orchestrator" for backtesting and trade automation.
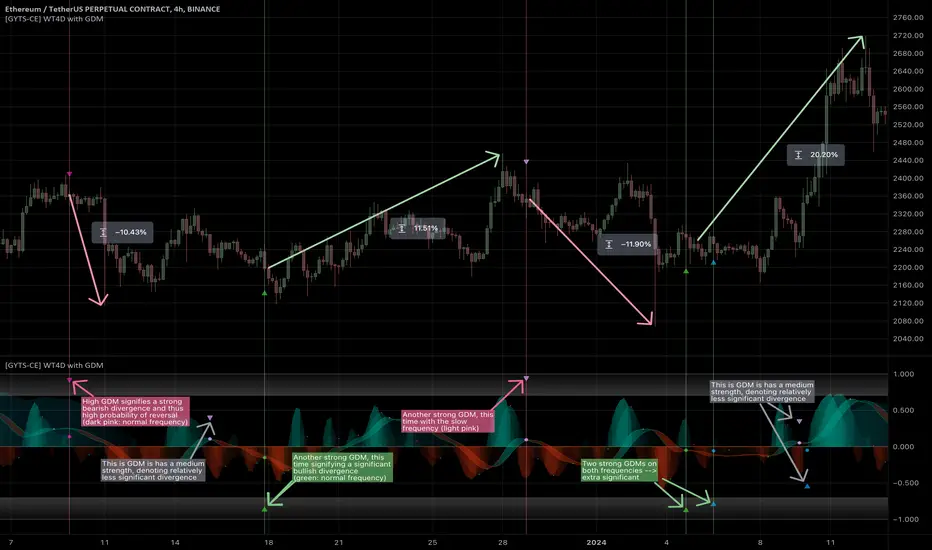
[GYTS-CE] Signal Provider | WaveTrend 4D with QMCWaveTrend 4D with Quantile Median Crosses (Community Edition)
🌸 " 📡 Signal Provider" in GoemonYae Trading System (GYTS) 🌸
WaveTrend 4D (WT4D) is an extension of the incredible WaveTrend 3D (2022, Justin Dehorty) . This oscillator elevates the classic WaveTrend by integrating advanced mathematical models for a multi-dimensional view of market momentum, capturing subtle shifts and trends that traditional indicators might miss. Each oscillator layer uses a combination of normalised derivatives, hyperbolic tangent transformations, and dual-pole filtering (John Ehlers' SuperSmoother), providing normalised and smooth signals with minimised lag.
The name "WaveTrend 4D" is derived from the usage of 4 dimensions, representing different frequencies or timeframes. Next to the "fast", "normal" and "slow" frequency, the fourth frequency is called "lethargic" (very slow). This gives the opportunity utilise more dimensions without having abundant signals, since we quantify and filter the quality of signals.
WT4D strives to help discriminating high-quality signals from the indicator by introducing the Gradient Divergence Measure (GDM) and Quantile Median Crosses (QMC). For simplicity, speed and focus, this particular indicator includes only the QMC part. Check the other 🤲Community Edition of this indicator that focuses on the GDM. For QMC, see below for more information.
🌸 --- QUANTILE MEDIAN CROSSES (QMC) --- 🌸
💮 Introduction
--
A powerful approach when working with WaveTrend is to use the frequencies' crossings of the median (zero) line. This would signify a continuation of the reversal. However, not all of those crossings would be trades with a high probability of success. For this reason, we strive to only consider reversals after the most strong trends start to show weakness. We call these reversals the "Quantile Median Crosses" (QMC), deriving the name from the used methodology.
💮 Methodology
--
To find these "most strong trends", we calculate the integral ("the area") of a frequency between all historical median crosses, and take an upper quantile of those integrals. This means that when the frequency is crossing the median in a period of consolidation, the areas between those crosses would be small. But if there was a strong momentum, and the frequency would separate itself significantly from the median and would do so for a long time, its area would be large.
So after considering all the past integrals, we take the upper quantile of those (i.e. sort all integrals and for example take the top 5%) and if the latest trend's integral was in this upper quantile, it is considered "significant". Hence, the name "quantile" in the name "Quantile Median Cross".
💮 QMC on the Oscillator
--
The QMC is shown as a label "🔴" above the median or with "🟢" below the median. The normal frequency has a "bronze" colour, the slow frequency "silver" and the lethargic is "gold". In addition to the labels, there are also diamond shapes in the same colour drawn on the median in the oscillator. This represents the previous median crossing, and helps the user to see between which two points the integral is calculated.
🌸 --- GOEMONYAE TRADING SYSTEM --- 🌸
As previously mentioned, this indicator is a 📡 Signal Provider, part of the suite of the GoemonYae Trading System (🤲 Community Edition). The greatest value comes from connecting multiple 📡 Signal Providers to the 🧬 Flux Composer to find confluence between signals. Contrary to most other indicators that connect with each other, the signals that are passed are not just binary signals ("buy" or "sell") but pass the actual GDM and QMC values. This gives the opportunity in the 🧬 Flux Composer to more accurately use multiple signals with different strengths to finally give an overall signal. On its turn, the Flux Composer can be connected to the GYTS "🎼 Order Orchestrator" for backtesting and trade automation.

MTF Williams Vix Market Bottoms [CryptoSea]MTF Williams Vix Fix Indicator is a dynamic tool tailored for traders looking to capture market extremes with high precision. This multi-timeframe indicator leverages the concept of the Williams Vix Fix to spot potential reversals before they occur.
Key Features
Multi-Timeframe Analysis: Provides simultaneous visibility across multiple timeframes, enabling traders to assess market conditions comprehensively from a single chart.
Advanced Volatility Detection: Utilizes a modified Vix Fix formula to highlight extreme price deviations, which often precede significant market reversals.
Customizable Settings: Offers extensive input options to tweak the lookback periods, percentile thresholds, and visibility settings, aligning with various trading strategies.
Visual Band Indicators: Features upper bands and range highs that signal potential overbought and oversold conditions, enhancing trading decision-making.
Below, you can see how the indicator performs across different timeframes, providing valuable insights into market behavior.
How it Works
Vix Fix Calculation: Determines the worst-case 'panic' sell-offs in price as a percentage of the high, capturing the emotional extremes of the market.
Statistical Bands: Employs Bollinger bands over the Vix Fix values to define normal and extreme volatility conditions.
Color-Coded Indicators: Uses color differentiation to instantly highlight when readings surpass critical upper band or range high thresholds, signaling key trading opportunities.
For instance, in the analysis provided below, notice how the indicator flags significant market moves, allowing traders to anticipate potential entry or exit points.
Application
Risk Management: Aids in identifying extreme market conditions where prices may revert, helping in effective position sizing and risk management.
Strategic Planning: Enhances strategic trading plans by identifying not only when but also where market extremes may occur, considering multiple timeframes.
Customization: Adapts seamlessly to different market environments with adjustable settings for volatility thresholds and visual display preferences.
The MTF Williams Vix Fix Indicator by is an essential tool for traders aiming to leverage market volatility for optimal entry and exit, ensuring they are well-equipped to handle market extremes with confidence.

HTF Candle Consistency [LuxAlgo]The HTF Candle Consistency indicator tracks the most recent candle sentiment in up to 10 Higher Timeframe (HTF) and colors the user chart candle bodies based on the dominating sentiment. Users can weigh specific timeframes more significantly.
Additionally, the script provides an HTF dashboard that displays the current directional readouts for each selected timeframe to allow for an independent HTF analysis.
🔶 USAGE
Analyzing the movement and direction of higher timeframe candles can help filter out noisy variation from the price, and could be utilized to time trades better. When the majority of recent candles from the selected timeframes are bullish, the candle body will be colored in green, if this majority is bearish it will be colored in red.
Using the "Tricolor" coloring mode introduces a third coloring option, and is used when there isn't a clear sentiment majority across the selected timeframes, this option effectively allows for filtering out unwanted trends.
Users can control the variations to be filtered out depending on their chart timeframe and the enabled HTF's in the settings. Using low timeframes with higher HTF's will gray out a larger amount of candles, disabling these timeframes, changing them, or giving higher weighting to lower HTF's will allow for obtaining more dominance detection, and as such less grayed-out candles.
As seen above, the weight function allows for precise control over the specific elements being analyzed.
This indicator also features a dashboard for viewing each timeframe's direction at the same time. By doing so, it allows for better judgment on the specific elements composing the current HTF majority.
🔶 DETAILS
This indicator is only intended for Higher Timeframe Analysis, all the input timeframes should be kept equal to or lower than your current chart timeframe.
NOTE: This is necessary for data accuracy in most multi-timeframe indicators, and is generally a good practice to keep in mind.
As a reminder, the dashboard will display the timeframe in red text if a lower timeframe is detected. It is recommended to change or disable this timeframe for your analysis.
This indicator can support up to 10 timeframes, each with independent weightings.
NOTE: When a timeframe is disabled, the dashboard will no longer display that timeframe, and it will not be used in calculations.
🔹 Candle Coloring
Candle color can be selected between 3 modes.
Tricolor (Default): Changes the color based on a 3-part split of the possible data sum range.
Bicolor: Changes the color based on the sum being greater than or less than 0.
Gradient: Uses a 3-color gradient to determine the candle color based on the possible data sum range.
🔶 SETTINGS
🔹 Higher Timeframes
Toggle: Enable/Disable the timeframe from analysis.
Timeframe: Select which timeframe to use for analysis. <- NOTE: This input reflects any custom intervals you have created on Tradingview.
Weight: Determines the Weighting (Multiplier) for the timeframe's direction.
🔹 Style
Color Mode: (More details above) Determines the color mode in use for coloring candles.
🔹 Dashboard
General Settings: Control Toggle, Location, & Size of Dashboard on your chart.
Orientation: Choose to display the dashboard in a "Vertical (default)" or "Horizontal" orientation to fit your style.

Multi Timeframe Trend Screener [TradeDots]The "Multi Timeframe Trend Screener" is a trading indicator designed to assist traders in identifying the market trends of multiple assets within a single panel. This tool is invaluable for detecting shifts in trends, enabling traders to easily adjust their strategies under different market conditions.
HOW DOES IT WORK
Upon initialization, the indicator requires users to input two key pieces of information:
The assets to be monitored.
The timeframes to be analyzed.
The tool is capable of simultaneously tracking up to four assets across five distinct timeframes.
By specifying the type and length of the moving average, the indicator uses this data as a baseline to determine the current market trend.
A price movement below the moving average triggers a downward trend symbol (📉), indicating bearish conditions.
Conversely, a movement above the moving average displays an upward trend symbol (📈), signaling bullish conditions.
The aggregation of moving averages across various timeframes provides a comprehensive view of the overall market sentiment.
APPLICATION
In scenarios where the market consistently demonstrates an upward trend, each timeframe will display a bullish symbol. Shifts in market sentiment typically start in the shorter timeframes and can progressively affect longer ones if the trend continues.
This cascading effect allows the indicator to show all timeframes transitioning to a bearish orientation when the trend reverses.
The indicator also facilitates comparison between different assets. For assets with high correlation, a trend shift in one can often predict similar movements in correlated assets, thus allowing traders to swiftly adapt their strategies to align with new market conditions.
RISK DISCLAIMER
Trading entails substantial risk, and most day traders incur losses. All content, tools, scripts, articles, and education provided by TradeDots serve purely informational and educational purposes. Past performances are not definitive predictors of future results.

[GYTS-Pro] Signal Provider | WaveTrend 4D with GDM + QMCWaveTrend 4D with GDM + QMC (Professional Edition)
🌸 " 📡 Signal Provider" in GoemonYae Trading System (GYTS) 🌸
WaveTrend 4D (WT4D) is an extension of the incredible WaveTrend 3D (2022, Justin Dehorty) . This oscillator elevates the classic WaveTrend by integrating advanced mathematical models for a multi-dimensional view of market momentum, capturing subtle shifts and trends that traditional indicators might miss. Each oscillator layer uses a combination of normalised derivatives, hyperbolic tangent transformations, and dual-pole filtering (John Ehlers' SuperSmoother), providing a normalised and smooth signals.
WT4D strives to help discriminating high-quality signals from the indicator by introducing the Gradient Divergence Measure (GDM) and Quantile Median Crosses (QMC) -- see below for more information.
WaveTrend 4D is a "📡 Signal Provider" in the 🌸 GoemonYae Trading System (GYTS) 🌸. Multiple 📡 Signal Providers connect to a GYTS "🧬 Flux Composer" to find confluence. On its turn, the Flux Composer can be connected to the GYTS "🎼 Order Orchestrator" for backtesting and trade automation. However, WaveTrend 4D is a wonderful indicator on its own as well.
🌸 --- MAIN FEATURES --- 🌸
- The focus is on two type of signals: divergences between the overall trend and the waves (GDM) and the weakening of strong trends (QMC)
- The name "WaveTrend 4D" is derived from the usage of 4 dimensions, representing different frequencies or timeframes. This gives the opportunity to use 2 sets of 3 frequencies to find divergences. Next to the "fast", "normal" and "slow" frequency, the fourth frequency is called "lethargic" (very slow).
- High probability trading involves diligently determining the significance of signals. For this purpose, a novel "Gradient Divergence Measure" (GDM) is developed to signify the strength of divergence signals and are drawn as triangles next to the divergence circles.
- Another and powerful approach is to use the frequencies' crossing of the median (zero) line. We seek to only signal reversals after a significant trend, and call this the "Quantile Median Crosses" (QMC).
More information the GDM and QMC and details of all features are described below.
🌸 --- GRADIENT DIVERGENCE MEASURE (GDM) --- 🌸
💮 Introduction
--
The GDM dynamically calculates a composite measure based on multiple factors. Unlike traditional binary divergence indicators, GDM employs a continuous value system to capture the nuanced dynamics of market behaviour. This methodology allows traders and analysts to assess the potency of divergence signals with greater precision, facilitating more informed decision-making processes.
💮 Methodology
--
The GDM is calculated using a composite formula that integrates various market dynamics. At its core, it consists of six components listed below, each weighted to optimize the indicator's responsiveness to market conditions:
The magnitude of relative change between waves -- A larger difference between the waves, i.e. lower high or higher low could signify a stronger divergence.
The absolute value of the latest wave -- The strength of the latest wave provides insight into the extremity of the market conditions.
Slope of the divergence -- The slope between the two points of divergence essentially measures the rate of change in the frequency\'s value over time. It captures both the direction and the steepness of the indicator’s move between two waves.
The magnitude of relative change of the price -- A divergence means that the oscillator shows an opposite pattern than price action. Thus, if the price makes a significantly higher high or lower low, but the indicator does not, this discrepancy can be used to measure the divergence strength. This components measures the price's extrema during the crosses of the indicator's waves.
Higher timeframe's frequency trend -- Similarly, instead of looking at the price directly, this component measures the more general trend of the price by using the higher timeframe frequency (i.e. the slow frequency when looking at divergences of the normal frequency).
Time duration -- Lastly, the time duration between the two points of a divergence can also be a factor. A divergence that spans over a longer period might indicate a more significant market sentiment shift.
Note that these 6 components are not independent, e.g. the slope is actually the result of the magnitude between waves, the absolute value and time duration. However, the default GDM is carefully tuned to include all these features without being too sensitive to outliers.
💮 Tuning the GDM
--
At the same time, different people have different ideas of what factors are important to denote a "strong" divergence. For this reason, in the 🧰 Professional Edition of this indicator, as opposed to the 🤲 Community Edition, the user can select between different "GDM profiles" that resemble a certain approach:
Upon initiating the GDM indicator, users are prompted to select one of six distinct profiles. Each profile adjusts the indicator’s parameters to optimize performance under different market scenarios:
balanced : Offers a general approach, with a balanced assessment of market conditions without specific focus on any one aspect.
regular divergence : Emphasises price action, ideal for identifying classical divergence patterns where price and momentum diverge.
wavetrend focus : Minimises the influence of price action, concentrating on the WaveTrend oscillator’s behaviour for trend analysis.
short-term waves : Prioritises the slope of the waves, targeting traders interested in short-term market movements and potential inflection points.
long-term waves : Extends the analysis period, focusing on longer-term market trends and wave duration for strategic positioning.
overbought/oversold : Highlights extreme conditions in market valuation, useful for identifying potential reversal points from overbought or oversold levels.
The 🎩 Ultimate Edition takes it a step further and gives full freedom to dial in weights for each of the 6 components. The GDM formula is set up in such way to accommodate ease of use and react logically to these parameters. Having said that, the default GDM calculation should be more than sufficient for most cases.
Another way of tuning the GDM is to dial in the "sensitivity". This controls the extent of normalisation between signals, and essentially affects how often strong GDMs appear. At the conservative end (higher sensitivity), the strong GDMs are less frequent but are relatively significant, while with a lower sensitivity the strong GDMs appear more frequent.
💮 GDM on the Oscillator
--
Coming back to the indicator, the GDMs are represented by triangles and their value represents the strength. A value close to `1` signifies a strong bearish divergence and thus a possible reversal of continuation of a downtrend. Similarly, a value close to `-1` signifies a strong bullish divergence.
Note that there are two colour sets which can be enabled and disabled. One uses crosses between the fast and normal frequencies (with the slow frequency acting as the price trend with which there should be an opposite interaction -- "divergence"). Similarly, crosses between the normal and slow frequencies (with the lethargic (the most slow) frequency acting as the price trend) are used to find divergences on a higher timeframe.
🌸 --- QUANTILE MEDIAN CROSSES (QMC) --- 🌸
💮 Introduction
--
A different and powerful approach is to use the frequencies' crossing of the median (zero) line. This would signify a continuation of the reversal. However, also here, not all of those crossings would be trades with a high probability of success. For this reason, we seek to only consider reversals after the most strong trends start to show weakness. We call these reversals the "Quantile Median Crosses" (QMC), derived from the methodology.
💮 Methodology
--
To find this "most strong trends", we calculate the integral ("the area") of a frequency between all historical median crosses, and take an upper quantile of those integrals. This means that when the series is crossing the median in often (consolidation), the ares between those crosses would be small. But if there was a strong momentum, and the series would separate itself significantly from the median and would do so for a long time, its area would be large.
So after considering all the past integrals, we take the upper quantile of those (i.e. sort all integral and for example take the top 5%) and if the latest trend's integral was in this upper quantile, it is considered "significant". Hence, the name "quantile" in the name "Quantile Median Cross"
💮 Tuning the QMC
--
The QMC is easily tuned by its "sensitivity". This basically represents a set of quantile bounds for the normal, slow and lethargic series. We have set these 3 parameters for each sensitivity profile after careful testing. The 🎩 Ultimate Edition gives full control for each quantile bound.
💮 QMC on the Oscillator
--
The QMC is shown as a label "🔴" above the median or with "🟢" below the median. In the 🎩 Ultimate Edition, the user instead sees the exact quantile and the number of samples. The normal frequency has a "bronze" colour, the slow frequency "silver" and the lethargic is "gold". In addition to the labels, there are also diamond shapes in the same colour drawn on the median in the oscillator. This represents the previous median crossing, and helps the user to see between which two points the integral is calculated.
🌸 --- DETAILED FEATURES --- 🌸
As discussed, at its core, the main signals are the Gradient Divergence Signals (GDM) and Quantile Median Crosses (QMC). However, there are more very powerful features that this 📡 Signal Provider can include. Below is a list of all features and we differentiate the availability of a feature per 📡 Signal Provider version by using these icons: 🤲 Community Edition; 🧰 Professional Edition; 🎩 Ultimate Edition.
Before going into the features, there are two important aspects to note: As this is a 📡 Signal Provider, it can be connected to the GYTS 🧬 Flux Composer and this is possible for each edition (i.e. the 🤲 Community Edition 📡 Signal Composer works with the 🤲 Community Edition 🧬 Flux Composer, and the same holds for the 🧰 Professional and 🎩 Ultimate Editions). Contrary to most other indicators that connect with each other, the signals that are passed are not just binary signals ("buy" or "sell") but pass the actual GDM and QMC values. This gives the opportunity in the 🧬 Flux Composer to more accurately use multiple signals with different strengths to finally give an overall signal.
The second important aspect is that for the 🤲 Community Edition, there are two versions of this 📡 Signal Provider: one that has the GDM feature and another the QMC feature. Besides that, the list below depicts a fairly complete overview of all the features across different versions:
( 🤲 🧰 🎩 ) Four Dimensions -- All four dimensions are available for each edition. The input data can also be transformed with an EMA or CoG as in the original WaveTrend 3D.
( -- 🧰 🎩 ) Both GDM and QMC -- Only the Pro and Ult versions include both the GDM and QMC in one indicator
( 🤲 🧰 🎩 ) Custom indicator name -- There's an option to give a name to the indicator which will be displayed on the chart. On its own, it might not be helpful, but in the GoemonYae Trading System (GYTS) suite, it helps to identify the different Signal Providers.
( 🤲 🧰 🎩 ) Visual improvements -- As in the original WaveTrend 3D, there are various ways the indicator can be displayed, including emphasising a certain frequency, a "mirror mode" and separating each frequency. We have expanded on some of these options. For example, the divergences, GDMs and QMCs are also displayed when the frequencies are separated, the mirror mode works with the emphasised frequency, there are more options to control the width of the emphasised frequency and each frequency can be enabled or disabled.
( 🤲 🧰 🎩 ) Support for HTF -- The indicator works on higher timeframes than the current chart and all parameters and calculations are scaled accordingly.
( __ 🧰 🎩 ) Support for other tickers -- There is also an option to select another ticker than the current chart. This especially makes sense in the 🌸 GYTS suite 🌸, where multiple Signal Providers are combined to find confluence. For example, a common approach is to use a certain ETF (or BTC in crypto) on a higher timeframe as filter to determine overall market direction.
( __ __ 🎩 ) Disable "only true divergences" -- In the Ultimate Edition, less signals can be filtered out when disabling looking at the third frequency. In general, this is not the best idea but it can be helpful when filtering signals with other means.
( __ 🧰 __ ) GDM profiles -- As mentioned, the GDM is carefully tuned and we consider it an excellent method to signify the strength of a divergence. Therefore, the standard calculation in the Community Edition is sufficient. Nevertheless, the Pro Edition has profiles (as previously described) so the user can select how (s)he feels a "strong divergence" should be.
( __ __ 🎩 ) GDM weights -- Full control over the weights of the 6 components of the GDM instead of using the profiles. The GDM algorithm is set up in such way that this is possible in an intuitive way.
( __ __ 🎩 ) Disable asymmetric GDM calculation -- Calculate the bullish and bearish GDMs independently (asymmetric calculation) or normalise them altogether (symmetric calculation). This can sometimes be helpful to filter out weaker GDMs depending on market conditions.
( 🤲 🧰 🎩 ) QMC calculation -- Using the QMC is possible in all versions, and each of the Normal, Slow and Lethargic frequencies can be toggled on and off.
( __ 🧰 __ ) QMC sensitivity -- Similar to the GDM profiles, in the Pro version there are presets to make the sensitivity higher (and thus get more signals) or lower.
( __ __ 🎩 ) QMC quantile threshold -- Instead of the sensitivity presets, in the Ult Edition the quantile threshold for each frequency is set. The user also sees the actual quantile and number of samples in the label
( 🤲 🧰 🎩 ) WaveTrend 4D settings -- Possibility to adjust the core WaveTrend settings
( 🤲 🧰 🎩 ) Alerts -- When alerts are enabled, TradingView will notify when there is a bullish/bearish strong GDM (i.e. within the zone) and a bullish/bearish QMC.
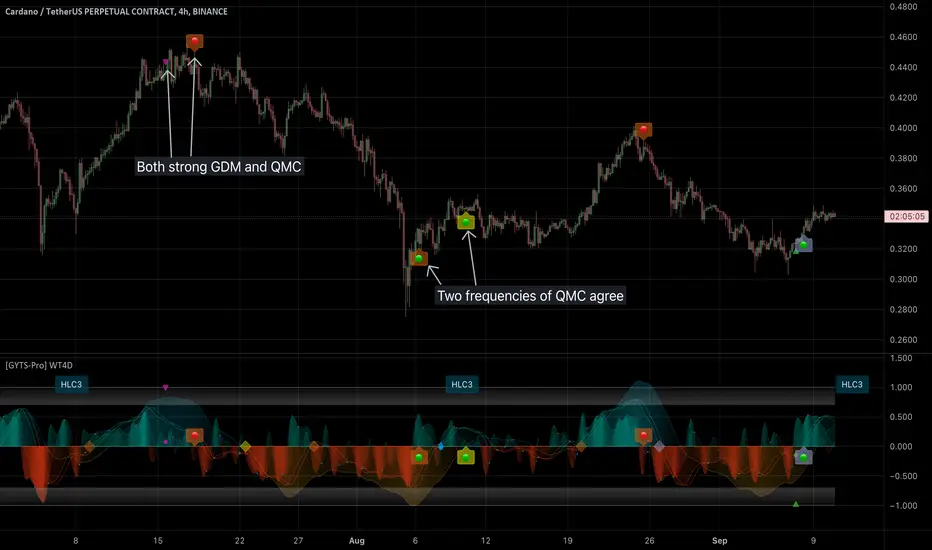
Fibonacci Adaptive Timeframe EMA (FAT EMA)The "Fibonacci Adaptive Timeframe EMA" is a sophisticated trading indicator designed for the TradingView platform, leveraging the power of Exponential Moving Averages (EMAs) determined by Fibonacci sequence lengths to provide traders with dynamic market insights. This indicator overlays directly on the price chart, offering a unique blend of trend analysis, smoothing techniques, and timeframe adaptability, making it an invaluable tool for traders looking to enhance their technical analysis strategy.
Key Features
1. Fibonacci-Based EMA Lengths: Utilizes the Fibonacci sequence to select EMA lengths, incorporating natural mathematical ratios believed to be significant in financial markets. The available lengths range from 1 to 987, allowing for detailed trend analysis over various periods.
2. Multiple Smoothing Methods: Offers the choice between several smoothing techniques, including Simple Moving Average (SMA), Exponential Moving Average (EMA), Smoothed Moving Average (SMMA or RMA), Weighted Moving Average (WMA), and Volume Weighted Moving Average (VWMA). This versatility ensures that users can tailor the indicator to suit their analytical preferences.
3. Timeframe Adaptability: Features the ability to fetch and calculate EMAs from different timeframes, providing a multi-timeframe analysis within a single chart view. This adaptability gives traders a broader perspective on market trends, enabling more informed decision-making.
4. Dynamic Visualization Options: Traders can customize the display to suit their analysis needs, including toggling the visibility of Fibonacci EMA lines, EMA prices, and smoothed EMA lines. Additionally, forecast lines can be projected into the future, offering speculative insights based on current trends.
5. Ema Tail Visualization: An innovative feature allowing for the visualization of the 'tail' or the continuation of EMA lines, which can be particularly useful for identifying trend persistence or reversal points.
6. User-friendly Customization: Through a series of input options, traders can easily adjust the source data, Fibonacci lengths, smoothing method, and visual aspects such as line colors and transparency, ensuring a seamless integration into any trading strategy.
Application and Use Cases
The "Fibonacci Adaptive Timeframe EMA" indicator is designed for traders who appreciate the significance of Fibonacci numbers in market analysis and seek a flexible tool to analyze trends across different timeframes. Whether it's for scalping, day trading, or long-term investing, this indicator can provide valuable insights into price dynamics, trend strengths, and potential reversal points. Its adaptability makes it suitable for various asset classes, including stocks, forex, commodities, and cryptocurrencies.
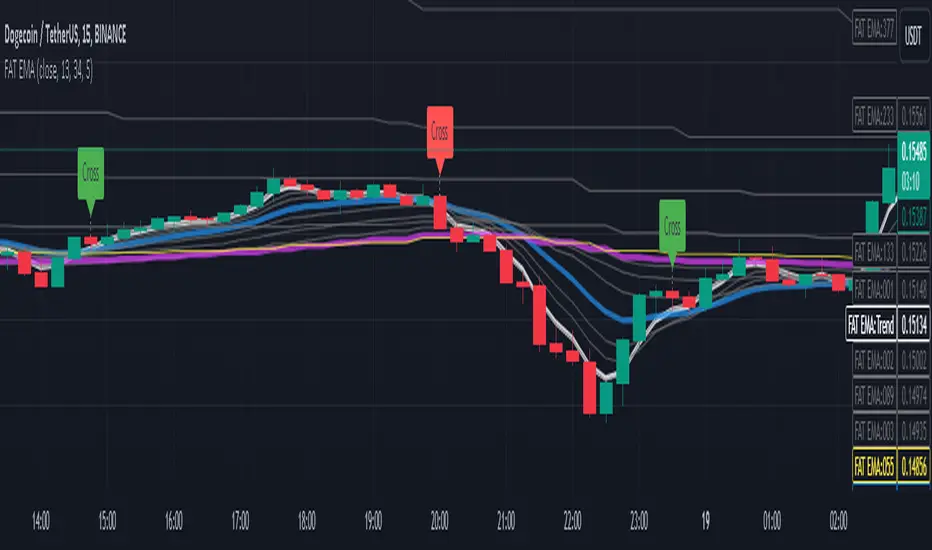
EMA Cross Dashboard | Flux Charts💎 GENERAL OVERVIEW
Introducing our new Exponential Moving Average (EMA) Cross Dashboard! This dashboard let's you select a source for the calculation of the EMA of it, then let's you enter 2 lengths for up to 5 timeframes, plotting their crosses in the chart.
Features of the new EMA Cross Dashboard :
Shows EMA Crosses Across Up To 5 Different Timeframes.
Select Any Source, Including Other Indicators.
Customizable Dashboard.
📌 HOW DOES IT WORK ?
EMA is a widely used indicator within trading community, it is similar to a Simple Moving Average (SMA) but places more weight on recent prices, making it more reactive to current trends. Crosses of EMA lines can be helpful to determine strong bullish & bearish movements of an asset. This indicator shows finds crosses across 5 different timeframes in a dashboard and plots them in your chart for ease of use.
🚩UNIQUENESS
This dashboard cuts through the hassle of manual EMA cross calculations and plotting. It offers flexibility by allowing various data sources (even custom indicators) and customization through enabling / disabling individual timeframes. The clear visualization lets you see EMA crosses efficiently.
⚙️SETTINGS
1. Timeframes
You can set up to 5 timeframes & 2 lenghts to detect crosses for each timeframe here. You can also enable / disable them.
2. General Configuration
EMA Source -> You can select the source for the calculation of the EMA here. You can select sources from other indicators as well as more general sources like close, high and low price.

[AlbaTherium] MTF External Ranges Analysis - ERA-Orion for SMC MTF External Ranges Analysis - ERA - Orion for Smart Money Concepts
Introduction:
The MTF External Ranges Analysis - ERA - Orion offers enhanced insights into multi-timeframe external structure points, swing structure points, POIs (Points of Interest), and order blocks (OB) . By incorporating this enhancement, your multi-timeframe analysis are streamlined, simplifying the process and reducing chart workload, no need for manual chart drawing anymore, stay focus on Low Time Frame and get High Time Frame insights in one single Time frame.
This identification process remains effective even when focusing on Lower Time Frames (LTF), providing detailed insights without sacrificing the broader market perspective.
The MTF External Ranges Analysis - ERA – Orion is specifically designed to be used in conjunction with OptiStruct™ Premium for Smart Money Concepts . This strategic combination enhances the workflow of identifying optimal entry points. OptiStruct acts as the analysis tool for Lower Time Frames (LTF), zeroing in on immediate interest areas, while Orion expands this analysis to Higher Time Frames (HTF), providing a broader view of market trends and importants key levels . The integration of Orion with OptiStruct seamlessly merges LTF and HTF analyses, ensuring a thorough understanding of market dynamics for informed and strategic decision-making. This toolkit in one package assembly is pivotal for traders relying on Smart Money Concepts, offering unmatched clarity and actionable insights to navigate the markets effectively.
This tool offers an advanced smart money technical analysis to improve your trading experience. It introduces four key concepts:
Main Features:
Entries Enhancements
Inducements HTF
High/Low Markings HTF
Multiple Timeframes and Confluences on Extreme, Dec and SMT Order Blocks
By integrating these concepts into one, traders can identify high-probability zones across multiple timeframes and develop a thorough understanding of market dynamics. These confluence zones enhance order block skills and potential, establishing them as essential pillars in smart money trading strategies and enabling traders to make more informed decisions.
Settings Overview:
HTF Settings Enable HTF Analysis
Select timeframe {Select or 4H Chart}
Labels Alignment for Lines and Boxes
Inside bar ranges HTF
Break of Structure /Change of Character HTF
Inducements HTF
High/Low Markings HTF
High/Low Sweeps HTF
Extreme Order Blocks HTF
Decisional Order Blocks HTF
Smart Money Traps HTF
IDM Demands and Supplies HTF
Historical Order Blocks HTF
OB Mitigation HTF {touch/ extended}
Understanding the Features:
Chapter 1: Entries Enhancements
In this chapter, we delve into strategies to refine trading entries, focusing on the multi-timeframe analysis of extreme or decisional order blocks in the High Time Frame timeframe as a key point of interest. We highlight the significance of transitioning to the Low Time Frame chart for observing pivotal shifts in market behavior. By examining these concepts, traders can gain deeper insights into market dynamics and make more informed entries decisions at critical junctures.
Practical Example:
We had an Order Block Extreme on the 1-hour timeframe, and currently, we are on the recommended chart for trade entry, which is the 5-minute timeframe. We are patiently waiting to observe a 5-minute ChoCh in the market to enter a buying position since it's an OB Extreme Demand on the 1-hour timeframe. Here, it's crucial and important to focus on the entry timeframe rather than checking what's happening in the higher timeframe. The indicator facilitates this task as it provides us with real-time perspective and visibility of everything happening in the higher timeframe.
Chapter 2: Inducements HTF
It is important and useful to be aware of the various liquidity points across the different timeframes we use; sometimes, a reliable entry point in the Lower Time Frame (LTF) may be surrounded by inducements. Consequently, this point becomes unreliable, and prior to the arrival of this functionality, such anomalies could not be detected, especially when focusing on the market in the LTF. From now on, there will be no more such issues.
Practical Example:
Suppose we identify an Order Block Extreme on the 5M timeframe, indicating a potential entry level. However, when we switch to the 5M timeframe to look for an entry point, we observe an accumulation of inducements around this Order Block coming from a higher timeframe, whether it's M15 or H1. This suggests a potential weakness in the entry point and significant market liquidity, which will act as a trap zone. Before the introduction of this feature, we might have missed this crucial observation, but now we can detect these anomalies and adjust our strategy accordingly.
The only practical way to see theses confluences is to use this Indicator, see the example below
Chapter 03: High/Low – Bos - ChoCh Markings HTF
The High/Low Markings HTF feature in the MTF External Ranges Analysis - ERA - Orion provides a comprehensive view into the market's heartbeat across different timeframes, right from within the convenience of the Lower Time Frame (LTF). It meticulously highlights pivotal shifts, allowing traders to seamlessly discern market sentiment and anticipate potential price reversals without needing to toggle between multiple charts. This innovation ensures that critical market movements and sentiment across various timeframes are visible and actionable from a single, focused LTF perspective, enhancing decision-making and strategic planning in trading activities.
Understanding High/Low Markings in HTF Analysis
High/Low Markings in High Time Frame (HTF) analysis mark the market's extremities within a given period, pinpointing potential areas for reversals or continuation and delineating crucial support and resistance levels. These markings are not arbitrary but represent significant market responses, serving as essential indicators for traders and analysts to gauge market momentum and sentiment.
The Role of HTF in Market Analysis
HTF analysis extends a comprehensive view over market movements, distinguishing between ephemeral fluctuations and substantial trend shifts. By scrutinizing these high and low points across wider time frames, analysts can unravel the underlying market momentum, enabling more strategic, informed trading decisions.
Identifying High/Low Markings
Identifying these crucial points entails detailed chart analysis over extended durations—daily, weekly, or monthly. The search focuses on the utmost highs and lows within these periods, which are more than mere points on a chart. They are significant market levels that have historically elicited robust market reactions, serving as key indicators for future market behavior.
Real-world Example:
Chapter 04: Multiple Timeframes and Confluences on Extreme, Dec and SMT Order Blocks Across HTF
The Orion indicator serves as a bridge between the multiple dimensions of the market, enabling a unified and strategic interpretation of potential movements. It's an indispensable tool for those seeking to capitalize on major opportunity zones, where the convergence of diverse perspectives creates ideal conditions for significant market movements.
Designed to navigate through the data of different timeframes and market analysis, Orion provides a clear and consolidated view of major points of interest. With this indicator, traders can not only spot opportunity zones where consensus is strongest but also adjust their strategies based on the dynamic interaction of various market participants, all while remaining within the Lower Time Frame (LTF).
Conclusion:
MTF External Ranges Analysis - ERA - Orion for Smart Money Concepts as “ The Orion ” indicator captures consensus among scalpers, day traders , swing traders, and investors, turning key areas into major opportunities. It allows for precise identification of areas of interest by analyzing the convergence of actions from various market participants. In short, Orion is crucial for detecting and leveraging the most promising points of convergence in the market.
This identification occurs even while focusing on Lower Time Frames (LTF), allowing for detailed insights without losing the broader market perspective.
This document provides an extensive overview of MTF External Ranges Analysis - ERA - Orion , emphasizing its importance in comprehending market dynamics and utilizing essential smart money concepts trading principles.

SMA Cross Dashboard | Flux Charts💎 GENERAL OVERVIEW
Introducing our new Simple Moving Average (SMA) Cross Dashboard! This dashboard let's you select a source for the calculation of the SMA of it, then let's you enter 2 lengths for up to 5 timeframes, plotting their crosses in the chart.
Features of the new SMA Cross Dashboard :
Shows SMA Crosses Across Up To 5 Different Timeframes.
Select Any Source, Including Other Indicators.
Customizable Dashboard.
📌 HOW DOES IT WORK ?
SMA is a widely used indicator within trading community, it simply works by taking the mathematical average of a source by desired length. Crosses of SMA lines can be helpful to determine strong bullish & bearish movements of an asset. This indicator shows finds crosses across 5 different timeframes in a dashboard and plots them in your chart for ease of use.
🚩UNIQUENESS
This dashboard cuts through the hassle of manual SMA cross calculations and plotting. It offers flexibility by allowing various data sources (even custom indicators) and customization through enabling / disabling individual timeframes. The clear visualization lets you see SMA crosses efficiently.
⚙️SETTINGS
1. Timeframes
You can set up to 5 timeframes & 2 lenghts to detect crosses for each timeframe here. You can also enable / disable them.
2. General Configuration
SMA Source -> You can select the source for the calculation of the SMA here. You can select sources from other indicators as well as more general sources like close, high and low price.
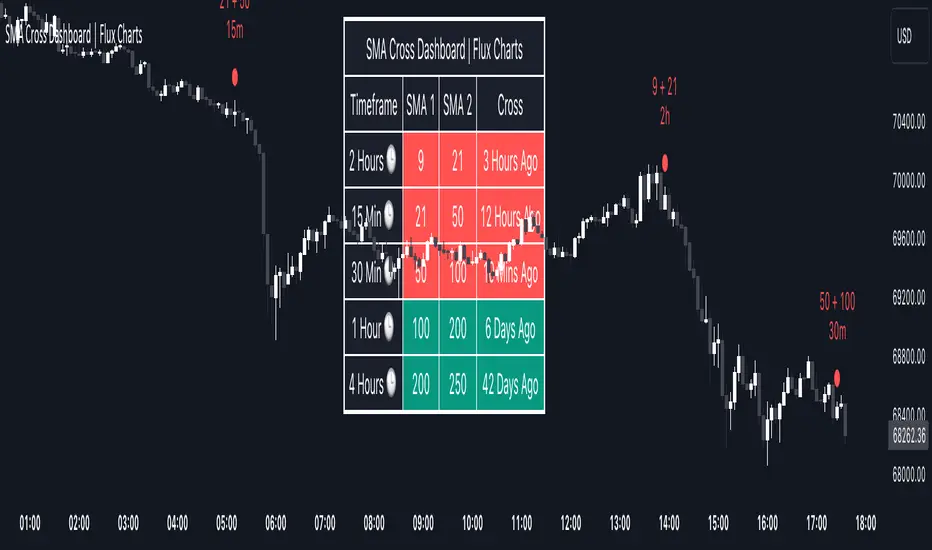
Volatility Filter v2VF v2 is a new iteration of my tool designed for traders who wish to gain a deeper understanding of market dynamics, specifically to distinguish periods of high volatility, which often correspond to strong market trends. By identifying these periods, traders can make more informed decisions, potentially leading to better trading outcomes.
Understanding Market Volatility:
At the heart of this script lies the concept of market volatility, a statistical measure reflecting the degree of variation in trading prices. Volatility is pivotal for traders; it provides insights into the market's emotional state, indicating periods of uncertainty or confidence. High volatility often correlates with strong trends, making it a critical indicator for trend-followers. By identifying when volatility crosses a certain threshold, traders can discern whether the market is likely to be in a trending phase or a more subdued, range-bound state.
How the Script Works:
The core functionality of the script revolves around a signal line that oscillates around a zero threshold. When the signal line is above zero, it indicates increased market volatility, suggesting the presence of a trend. The farther the oscillator deviates from zero, the stronger the implied trend. This mechanism enables traders to visually gauge market conditions and adjust their strategies accordingly.
Controlling the Indicator:
To cater to diverse trading styles and preferences, the script is equipped with several customizable settings:
Filter Threshold: This 'zero line' acts as the baseline for distinguishing between different volatility regimes. Crossing this threshold is a primary signal for changes in market volatility.
Moving Average Type: With over 30 types of moving averages to choose from, traders can select the one that best fits their analysis style. Each type offers a different perspective on price data, allowing for a tailored approach to trend identification.
Colorize Indicator: This feature enhances the visual representation of the indicator, making it easier to interpret. When enabled, the oscillator's color intensity varies with its proximity to the extremes, providing a quick visual cue about trend strength.
Advanced Settings – Length and Multiplier:
The script introduces an innovative approach to time frame analysis through its length and multiplier settings:
Length: This parameter sets the base period for all metrics within the script, similar to traditional indicators.
Multiplier: This unique feature differentiates the script by incorporating three distinct timeframes into the analysis: a lower timeframe, the main (current) timeframe, and a higher timeframe. The multiplier adjusts these timeframes relative to the main one. For instance, with a daily main timeframe and a multiplier of 2, the lower timeframe would be 12 hours, and the higher timeframe would be 2 days. This tri-timeframe approach aims to provide a more comprehensive volatility assessment.
Volatility Filter Indicators Section:
The script utilizes nine different, undisclosed metrics within its volatility filter. Traders have the flexibility to enable or disable these metrics based on their preferences, allowing for a customizable trading experience. Additionally, the script offers alert functionality for when the indicator crosses the threshold, either upwards or downwards, facilitating timely decision-making.
P.S
With better understanding of markets over time, I designed a new iteration of my volatility filter indicator. The second version provides faster, more precise way to analyze markets, but I also wanted to keep my first version untouched in case if some people find it better for their purposes. As I mentioned above, this version is calculated in a very different way from a previous one, so if you never tried it you can do it here
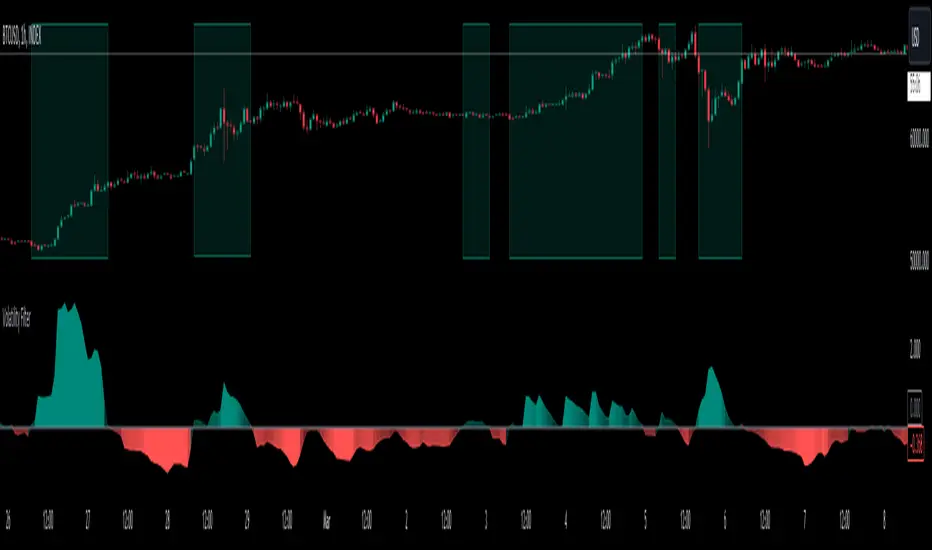
Momentum Concepts [AlgoAlpha]🚀 Introducing the Momentum Concepts™ , a robust multi-layered momentum analysis tool developed by AlgoAlpha . This All-in-One indicator offers a comprehensive approach to understanding market momentum, empowering traders with hyper customizable features to tailor their analysis to their specific trading strategies.
Designed with efficiency and compactness in mind, the script shows momentum regimes on three time horizons: The short-term ( Fast Oscillator ), medium-term ( Scalper's Momentum ) and long-term ( Momentum Impulse Oscillator and Hidden Liquidity Flow ). Additionally, the script also includes reversal signals for traders who prefer to trade contrarian/mean-reversion strategies. By utilizing a blend of advanced algorithms and customizable parameters, Momentum Concepts™ provides traders with a vast array of trading strategies ranging from high frequency scalping to timing better entries on long-term swing and investing positions.
Let's delve into the key features and functionalities of this versatile indicator:
🎯Key Features (summary):
Customizable Fast Oscillator: Tailor the fast oscillator to your preferences with adjustable settings for type, source, trend identification(signal processing) method, length, and more.
Divergence Detection: Identify potential trend reversals with ease using built-in divergence detection for both bullish and bearish signals.
Momentum Impulse Oscillator: Gain deeper insights into trending/ranging markets and underlying market bias with a dedicated oscillator, featuring adjustable trend impulse thresholds.
Scalper's Momentum: Utilize a specialized momentum indicator designed for scalping strategies, featuring agility in signal detection with noise reduction and customizable smoothing parameters.
Hidden Liquidity Flow Analysis: Assess hidden liquidity flows within the market, highlighting excess liquidity and potential squeeze situations.
Trend Confluence Indicator: Evaluate the overall momentum direction with dynamically colored zones, aggregating signals from Momentum Concepts™ components for a holistic view.
User-Friendly Interface: The indicator is presented in a clear and intuitive manner, making it accessible for traders of all experience levels.
All-Rounded Alerts: The indicator comes with a comprehensive alerts extension in a separate script, allowing you to stay informed of important market movements even when away from your trading platform.
🎯Key Features (in-depth):
The Fast Oscillator within Momentum Concepts™ comprises four components designed to provide insights into short-term momentum dynamics:
🔱Price Volume Swings :
This confirmation component uses our proprietary Price Volume Algorithm to analyze price action and volume to identify buying and selling pressure, aiding traders in spotting short-term swings for potential trading opportunities.
⚜️Price Volume Waves :
This leading component also uses our proprietary Price Volume Algorithm but differs from the Price Volume Swings by capturing dominant wave patterns instead. This indicator breaks down price and volume data into a wave-like plot which enables leading insights into market momentum due to the relatively predicable nature of sine-like waves. Leading components such as this and the Alpha Wave are best used with other confirmation components within the Momentum Concepts™ .
🌊Alpha Wave :
The Alpha Wave is a leading non-volume alternative to the Price Volume Waves . It reflects market momentum by analyzing price action only instead of using volume data, resulting in a normalized wave-like plot similar to that of the Price Volume Waves , offering a leading perspective on potential market momentum shifts. Leading components such as this and the Price Volume Waves are best used with other confirmation components within the Momentum Concepts™ .
🐲Dragon RSI :
The Dragon RSI is a confirmation component that determines market momentum by analyzing the directional movement of the Relative Strength Index (RSI). By doing so, users are able to visually identify the current short term trend of the market as well as identify overbought and oversold conditions.
Reversal Signals :
All the Fast Oscillator components come with reversal signals that are based on the respective components being either oversold or overbought.
Divergences :
All the Fast Oscillator components come with bullish and bearish divergences. Divergences within the Fast Oscillator components of Momentum Concepts ™ offer crucial signals for trend shifts. 🔱 Price Volume Swings and ⚜️ Price Volume Waves detect weakening buying or selling pressure, signalling potential reversals or continuations. 🌊 Alpha Wave and 🐲 Dragon RSI identify divergences between momentum and price, aiding traders in anticipating market movements. Leveraging these divergences enhances analysis, aiding traders in formulating meaningful analysis.
Customizable Signal Processing Methods :
All the Fast Oscillator components come with customizable signal processing methods to identify trends on the Fast Oscillator , they include (but not limited to) methods such as Heiken Ashi, and a vast selection of Moving Averages.
Diminishing Momentum Warning :
All the Fast Oscillator components come with a diminishing momentum warning that represents a reducing momentum on the Fast Oscillator . This can act as a take profit signal or as a precautionary warning that the price is about to change direction soon even though the Fast Oscillator has not detected it yet.
Dynamically Colored Reversal Zones :
Last but not least, the dynamic coloring of the reversal zones for Fast Oscillator can be customised based on either the reversal probability of the Fast Oscillator or based on the overall trend confluence of all the components within the Momentum Concepts™ indicator.
The Momentum Impulse Oscillator in Momentum Concepts™ offers crucial insights into long-term momentum trends, aiding traders in identifying the underlying momentum regime and differentiating between trending and consolidating markets.
Underlying Momentum Bias
By default, the Momentum Impulse Oscillator is set to show the longer term trend of price action, this can be used to set the directional bias for the markets and prevent users from trading against the trend.
Trending/Ranging Detection
The Momentum Impulse Oscillator comes with the option to enable trending thresholds, when the Momentum Impulse Oscillator is beyond these thresholds, it indicates a trending market, when Momentum Impulse Oscillator is within the thresholds, it indicates a consolidating/ranging market.
The Scalper's Momentum within Momentum Concepts™ furnishes traders with nuanced signals ideal for short to medium-term trading strategies. It efficiently displays both the medium-term momentum and any emerging divergences towards the opposing direction.
Medium-Term Momentum
The Scalper's Momentum is designed to fill the analysis gap between the Fast Oscillator and the Momentum Impulse Oscillator . Showing momentum insights over the medium-term.
Momentum Convergence-Divergence
The Scalper's Momentum is also capable of showing momentum convergences and divergences, which can be used as take-profit and/or confirmation signals to other components within Momentum Concepts™ .
The Hidden Liquidity Flow component of Momentum Concepts™ is designed to uncover underlying liquidity dynamics. This feature enables traders to anticipate potential price movements based on changes in liquidity flow, enhancing their ability to make informed trading decisions.
Underlying Liquidity Dynamics
The Hidden Liquidity Flow shows the underlying liquidity flow of the market, a positive liquidity flow indicates that liquidity is entering the market and increasing the probability of bullish price action, the opposite is true for negative liquidity flows.
Excess Liquidity Flow
The Hidden Liquidity Flow also indicates when there is an abnormal amount of liquidity flowing through the market, this can indicate the potential for volatility and explosive price action.
🎯Usage Examples:
Now that we have gone through the components and features of Momentum Concepts™ in detail, we'll walk you through the usage examples and strategies that you can utilise to navigate the markets.
Scalping
Using the Scalper's Momentum and the Fast Oscillator as an example, users can first use the Scalper's Momentum as a directional bias and the Fast Oscillator as a means of timing a more precise entry. Take profits can be based on either the Diminishing Momentum Warnings or the Fast Oscillator flipping signals or the Scalper's Momentum flipping signals.
Buying the Dip/Shorting the Pump
Using the Momentum Impulse Oscillator and the Fast Oscillator as an example, users will need to first determine the underlying trend with the Momentum Impulse Oscillator , after which they can use the Fast Oscillator for entry signals into the trend. Take profits can be based on either the Diminishing Momentum Warnings or the Fast Oscillator flipping signals
Reversal Trading
Using the Momentum Impulse Oscillator on a timeframe roughly 3-4 times greater than the chart's timeframe and the Fast Oscillator as an example, users will need to first ensure that the Momentum Impulse Oscillator signals a ranging market on a higher timeframe, divergence signals from the Fast Oscillator can then be used as entries. Take profits can be based on either the Diminishing Momentum Warnings or the Fast Oscillator flipping signals or the Fast Oscillator reaching the zero line.
(These are just examples for reference, the Momentum Concepts™ offers significantly more possibilities for customisation and fine tuning of your trading strategy.)
🎯Conclusion:
In conclusion, Momentum Concepts™ stands as a versatile and powerful tool for traders seeking to decode the intricacies of market momentum across multiple time horizons. With its comprehensive suite of customizable features, including the Fast Oscillator , Scalper's Momentum , Momentum Impulse Oscillator , and Hidden Liquidity Flow , traders can gain deep insights into market dynamics and make well-informed trading decisions. Whether executing high-frequency scalping strategies or timing entries for longer-term positions, Momentum Concepts™ equips traders with the tools they need to navigate diverse market conditions with confidence. By harnessing the power of momentum analysis, this indicator empowers traders to stay ahead of the curve and capitalize on emerging opportunities in the ever-evolving financial markets.
Script payant
