Kinetic Scalper [BULLBYTE]KINETIC SCALPER - ADVANCED MOMENTUM & CONFLUENCE TRADING SYSTEM
A SOPHISTICATED MULTI-FACTOR ANALYSIS INDICATOR FOR PRECISION ENTRIES
The Kinetic Scalper is a comprehensive trading analysis tool that combines volume-weighted momentum calculations, multi-oscillator divergence detection, and a proprietary 15-factor confluence scoring system to identify high-probability reversal setups across all timeframes.
WHAT MAKES THIS INDICATOR ORIGINAL
This is NOT a simple mashup of existing indicators.
The Kinetic Scalper features a completely custom momentum engine called the "Kinetic Pulse" - a volume-weighted momentum oscillator with Fisher Transform normalization that fundamentally differs from standard RSI or other momentum indicators. Every component feeds into a unified algorithmic framework designed specifically for this system.
KEY INNOVATIONS:
KINETIC PULSE ENGINE
Unlike standard RSI which uses simple price changes, the Kinetic Pulse applies:
→ Volume weighting to price movements (high-volume moves carry more weight)
→ EMA smoothing instead of traditional SMA (faster response to changes)
→ Fisher Transform normalization for improved signal clarity
→ Adaptive period adjustment based on current volatility regime
→ Result: A momentum oscillator that responds to conviction, not just price noise
15-FACTOR CONFLUENCE SCORING SYSTEM
Every signal is graded based on the number of confirming factors present:
→ Momentum position (oversold/overbought extremes)
→ Momentum velocity (direction change confirmation)
→ Momentum acceleration (strength of reversal)
→ Multi-oscillator divergence (price vs. 3 oscillators)
→ Volume confirmation (above-average participation)
→ Volume delta analysis (buying vs. selling pressure)
→ Higher timeframe alignment (trend confirmation from larger timeframe)
→ Session timing (major forex session awareness)
→ Structure clearance (clear path to profit targets)
→ Support/resistance proximity (confluence with key levels)
→ Market regime filtering (trending vs. choppy conditions)
Signals are graded A+, A, or B based on how many factors align:
• CONSERVATIVE MODE: A+ requires 12+ factors, A requires 9+, B requires 7+
• BALANCED MODE: A+ requires 10+ factors, A requires 7+, B requires 5+
• AGGRESSIVE MODE: A+ requires 8+ factors, A requires 5+, B requires 3+
TRADE ANALYSIS STATE MACHINE
A sophisticated monitoring system that tracks trade conditions in real-time using:
→ 5-state analysis framework (Factors Aligned / Positive Bias / Mixed Signals / Factors Weakening / Negative Bias)
→ Hysteresis-based transitions (different thresholds to enter vs. exit states)
→ Confidence smoothing with EMA (reduces noise, prevents flip-flopping)
→ Minimum commitment periods before state changes
→ Override logic for significant events (near TP/SL, momentum reversals)
→ Result: Stable, actionable guidance that doesn't change on every bar
INSTRUMENT-AWARE CALIBRATION
Automatically detects what you're trading and applies optimized parameters:
→ Forex Majors: Standard ATR, high session weight
→ Forex Crosses: Tighter stops, moderate session weight
→ Crypto: Wider stops (1.8x multiplier), reduced session weight (24/7 markets)
→ Indices: Moderate-wide stops, high session weight
→ Commodities: Moderate stops, moderate session weight
WHAT THIS INDICATOR DOES
The Kinetic Scalper is designed to identify high-confluence reversal opportunities by analyzing multiple dimensions of market behavior simultaneously.
CORE FUNCTIONS:
1. SIGNAL GENERATION
→ Identifies potential reversal points at oversold/overbought extremes
→ Confirms with multi-oscillator divergence detection
→ Validates with volume, higher timeframe, and structural analysis
→ Filters out low-probability setups automatically
→ Grades signals based on total confluence factors present
2. AUTOMATED TRADE TRACKING
→ Calculates structure-based or ATR-based stop loss levels
→ Projects take profit targets using risk-to-reward ratios
→ Monitors live position status (P/L, distance to targets, R-multiple)
→ Tracks TP1 and TP2 hits automatically
→ Displays outcome markers (TP HIT, PARTIAL WIN, STOPPED)
3. REAL-TIME CONDITION MONITORING
→ Analyzes 6 factor categories during active trades
→ Provides confidence scoring (0-100 scale)
→ Generates actionable guidance based on current market state
→ Alerts when conditions deteriorate or improve
→ Helps with trade management decisions
4. COMPREHENSIVE MARKET ANALYSIS
→ Session detection (Asian, London, New York, Overlap)
→ Volatility regime identification (Low, Normal, High, Extreme)
→ Trend state classification (Trending Up/Down, Ranging, Transitioning)
→ Volume analysis (relative volume and delta approximation)
→ Choppiness filtering (blocks signals in ranging markets)
WHY USE THIS INDICATOR
PROBLEM: Most momentum indicators generate too many false signals at extremes.
SOLUTION: The Kinetic Scalper requires MULTIPLE confirming factors before generating a signal, dramatically reducing noise and focusing on high-confluence setups.
ADVANTAGES:
✓ QUALITY OVER QUANTITY
→ Signal grading ensures you can filter for only the highest-quality setups
→ A+ signals have 10-12+ confirming factors aligned
→ Cooldown periods prevent over-trading the same move
✓ COMPLETE TRADE FRAMEWORK
→ Entry signals with confluence justification
→ Calculated stop loss based on market structure or ATR
→ Two profit targets with clear risk-to-reward ratios
→ Live trade monitoring with factor analysis
→ Outcome tracking and visual markers
✓ ADAPTIVE TO MARKET CONDITIONS
→ Volatility-based period adjustment for momentum calculations
→ Instrument-specific ATR multipliers
→ Session awareness for forex traders
→ Higher timeframe trend filtering
→ Automatic regime detection (trending vs. choppy)
✓ TRANSPARENT METHODOLOGY
→ Every input has detailed tooltips explaining its purpose
→ Signal tooltips show exactly why a signal was generated
→ Dashboard displays all relevant market conditions
→ Factor scores are visible during trades
→ No "black box" mystery calculations
✓ NON-REPAINTING & RELIABLE
→ All signals use barstate.isconfirmed (only on closed bars)
→ Higher timeframe data uses lookahead_off with historical offset
→ No future data access or repainting behavior
→ What you see is what you get - signals don't disappear or move
HOW THE INDICATOR WORKS
SIGNAL GENERATION PROCESS:
STEP 1: MOMENTUM ANALYSIS
The Kinetic Pulse engine calculates volume-weighted momentum:
→ Price changes are weighted by volume ratio vs. 20-bar average
→ High-volume moves have more influence on the oscillator
→ Gains and losses are smoothed using EMA (not SMA like RSI)
→ Fisher Transform is applied for normalization to 0-100 scale
→ Result: Momentum reading that emphasizes conviction, not noise
STEP 2: REVERSAL DETECTION
The indicator looks for potential reversal conditions:
→ Kinetic Pulse reaching oversold zone (below dynamic lower threshold)
→ Momentum velocity turning positive after being negative (for longs)
→ OR bullish divergence detected on multiple oscillators
→ Price making lower lows while oscillators make higher lows = divergence
STEP 3: MULTI-OSCILLATOR DIVERGENCE CONFIRMATION
Divergence is validated across three sources:
→ Kinetic Pulse divergence
→ CCI divergence
→ Stochastic divergence
→ Multiple oscillators confirming divergence increases signal reliability
STEP 4: CONFLUENCE FACTOR SCORING
The system evaluates all 15 possible confirming factors:
→ Momentum position: Is pulse oversold/overbought? (+0 to +2 points)
→ Momentum direction: Is velocity reversing? (+0 to +2 points)
→ Momentum acceleration: Is reversal strengthening? (+0 to +1 point)
→ Divergence count: How many oscillators show divergence? (+0 to +2 points)
→ Volume strength: Is volume above 1.3x average? (+0 to +1 point)
→ Volume delta: Is cumulative delta positive/negative? (+0 to +1 point)
→ HTF alignment: Does higher timeframe support direction? (+0 to +2 points)
→ Session timing: Is it a prime trading session? (+0 to +1 point)
→ Clear air: Is path to targets clear of obstacles? (+0 to +1 point)
→ Structure confluence: Are we near support/resistance? (+0 to +1 point)
→ Market regime: Is market trending, not choppy? (+0 to +1 point)
Total possible score: 15 points
Minimum for signal: 3-12 points depending on sensitivity mode
STEP 5: FILTER VALIDATION
Before generating a signal, additional checks are performed:
→ Volume must be above minimum threshold (if filter enabled)
→ Higher timeframe must not oppose the signal direction (if filter enabled)
→ Target path must be clear of major resistance/support (if filter enabled)
→ Volatility must not be EXTREME (blocks signals in chaos)
→ Risk-to-reward ratio must meet minimum requirement
→ Cooldown period must have elapsed since last signal
STEP 6: SIGNAL GRADING
If all filters pass, the signal is graded based on score:
→ A+ Grade: Highest confluence (8-12+ factors depending on sensitivity)
→ A Grade: High confluence (5-9+ factors)
→ B Grade: Moderate confluence (3-7+ factors)
Only graded signals (A+, A, or B) are displayed.
STEP 7: TRADE LEVEL CALCULATION
Stop loss and targets are calculated automatically:
STOP LOSS METHODS:
• Structure-Based: Uses recent swing low/high with ATR buffer, constrained by min/max ATR limits
• ATR-Based: Pure ATR multiplier with min/max constraints
• Fixed ATR: Simple ATR multiplier, no adjustments
TARGET CALCULATION:
• TP1: Entry ± (Stop Distance × Target 1 R:R)
• TP2: Entry ± (Stop Distance × Target 2 R:R)
• Default: TP1 at 1.0 R:R (1:1), TP2 at 2.0 R:R (1:2)
STEP 8: TRADE MONITORING
Once a signal is taken, the indicator tracks:
→ Current P/L in ticks and R-multiples
→ Distance to each target in ATR units
→ Distance to stop loss in ATR units
→ TP1 hit detection (marks with label, updates lines)
→ TP2 hit detection (closes trade, marks outcome)
→ Stop loss hit detection (closes trade, differentiates partial vs. full loss)
STEP 9: FACTOR ANALYSIS (DURING TRADES)
The Trade Analysis Panel monitors 6 key factor categories:
→ Momentum: Is momentum still aligned with trade direction? (-15 to +15 pts)
→ Position: Current R-multiple position (-12 to +12 pts)
→ Volume: Is volume still supportive? (-6 to +6 pts)
→ HTF Alignment: Does HTF still support trade? (-6 to +8 pts)
→ Target Proximity: How close are we to targets? (0 to +10 pts)
→ Stop Proximity: Are we dangerously close to stop? (-15 to +3 pts)
Raw scores are summed and smoothed using 5-bar EMA to create Confidence Score (0-100).
STEP 10: STATE MACHINE TRANSITIONS
Based on smoothed confidence, the system transitions between 5 states:
→ FACTORS ALIGNED (72+): Everything looks good
→ POSITIVE BIAS (58-72): Conditions favorable
→ MIXED SIGNALS (48-58): Neutral conditions
→ FACTORS WEAKENING (22-48): Concerning signals
→ NEGATIVE BIAS (<22): Poor conditions
Hysteresis prevents rapid flipping between states (different entry/exit thresholds).
RECOMMENDED TIMEFRAMES & INSTRUMENTS
TIMEFRAME VERSATILITY:
Despite the name "Scalper," this indicator works on ALL timeframes:
✓ LOWER TIMEFRAMES (1m - 15m)
→ Ideal for: Scalping and very short-term trades
→ Expect: More signals, faster trades, requires active monitoring
→ Best for: Forex majors, liquid crypto pairs
→ Tip: Use Conservative sensitivity to reduce noise
✓ MID TIMEFRAMES (15m - 1H)
→ Ideal for: Intraday trading and day trading
→ Expect: Moderate signal frequency, 1-4 hour trade duration
→ Best for: Forex, indices, major crypto
→ Tip: Balanced sensitivity works well here
✓ HIGHER TIMEFRAMES (4H - Daily)
→ Ideal for: Swing trading and position trading
→ Expect: Fewer signals, higher-quality setups, multi-day trades
→ Best for: All instruments
→ Tip: Can use Aggressive sensitivity for more opportunities
INSTRUMENT COMPATIBILITY:
✓ FOREX MAJORS (EUR/USD, GBP/USD, USD/JPY, etc.)
→ Auto-detected or manually select "Forex Major"
→ Session filtering is highly valuable here
→ London/NY overlap generates best signals
✓ FOREX CROSSES (EUR/GBP, AUD/NZD, etc.)
→ Auto-detected or manually select "Forex Cross"
→ Slightly tighter stops applied automatically
→ Session weight reduced vs. majors
✓ CRYPTOCURRENCIES (BTC, ETH, SOL, etc.)
→ Auto-detected or manually select "Crypto"
→ Wider stops (1.8x multiplier) due to volatility
→ Session filtering less relevant (24/7 markets)
→ Works well on both spot and perpetual futures
✓ INDICES (S&P 500, NASDAQ, DAX, etc.)
→ Auto-detected or manually select "Index"
→ Session opens (NY, London) are important
→ Moderate stop widths applied
✓ COMMODITIES (Gold, Silver, Oil, etc.)
→ Auto-detected or manually select "Commodity"
→ Moderate stops and session awareness
→ Works well on both spot and futures
VISUAL ELEMENTS EXPLAINED
SIGNAL MARKERS:
The indicator offers 3 display styles (choose in settings):
• PREMIUM STYLE (Default)
→ Signal appears below/above candles with connecting line
→ Background panel with grade badge (LONG , SHORT , etc.)
→ Entry price displayed
→ Direction arrow pointing to entry candle
→ Most informative, best for detailed analysis
• MINIMAL STYLE
→ Simple dot marker with grade text next to it
→ Clean, unobtrusive design
→ Best for mobile devices or cluttered charts
→ Less visual noise
• CLASSIC STYLE
→ Diamond marker with grade badge below/above
→ Traditional indicator aesthetic
→ Good balance between info and simplicity
ALL STYLES INCLUDE:
→ Signal tooltips with complete trade plan details
→ Grade display (A+, A, or B)
→ Color coding (bright colors for A+, standard for A/B)
SIGNAL TOOLTIP CONTENTS:
When you hover over any signal marker, you'll see:
→ Signal direction and grade
→ Confluence score (actual points vs. required)
→ Reason for signal (divergence type, reversal pattern)
→ Complete trade plan (Entry, Stop, TP1, TP2)
→ Risk in ticks
→ Risk-to-reward ratios
→ Market conditions at signal (Pulse value, HTF status, Volume, Session)
TRADE LEVEL LINES:
When Trade Tracking is enabled:
• ENTRY LINE (Yellow/Gold)
→ Solid horizontal line at entry price
→ Shaded zone around entry (±ATR buffer)
→ Label showing entry price
→ Extends 20-25 bars into future
• STOP LOSS LINE (Orange/Red)
→ Dashed line at stop level
→ Label showing stop price and distance in ticks
→ Turns dotted and changes color after TP1 hit (breakeven implied)
→ Deleted when trade closes
• TAKE PROFIT 1 LINE (Blue)
→ Dotted line at TP1 level
→ Label showing price and R:R ratio (e.g., "1:1.0")
→ Turns solid and changes to green when hit
→ Deleted after TP1 hit
• TAKE PROFIT 2 LINE (Blue)
→ Solid line at TP2 level
→ Label showing price and R:R ratio (e.g., "1:2.0")
→ This is the "full win" target
→ Deleted when trade closes
OUTCOME MARKERS:
When trade milestones are reached:
• - Green label appears when first target is touched
• - Green label when second target is touched (trade complete)
• - Red label if stop loss hit before any target
• - Orange label if TP1 hit but then stopped out
PREVIOUS DAY LEVELS:
If enabled (Show Previous Day Levels):
• PDH (Previous Day High) - Solid red/orange line
→ Label shows "PDH: "
→ Useful resistance reference for intraday trading
• PDL (Previous Day Low) - Solid green line
→ Label shows "PDL: "
→ Useful support reference for intraday trading
BACKGROUND TINTS:
Subtle background colors indicate states:
→ Light green tint: Active long position being tracked
→ Light red tint: Active short position being tracked
→ Light orange tint: Extreme volatility warning (signals blocked)
DASHBOARD GUIDE
The indicator features TWO dashboard panels:
━━━━━━━━━━━━━━━━━━━━━━━━━━━━━━━━━━━━━━━━━━━━━━━━━━━━━━━━━━━━━━━━━━━━━━━━━━━━━
MAIN DASHBOARD (Top Right by default)
━━━━━━━━━━━━━━━━━━━━━━━━━━━━━━━━━━━━━━━━━━━━━━━━━━━━━━━━━━━━━━━━━━━━━━━━━━━━━
WHEN NO TRADE IS ACTIVE:
→ Bias: Current market bias (BULLISH, BEARISH, NEUTRAL, LEAN LONG/SHORT)
→ Based on Kinetic Pulse position and velocity
→ Helps you understand overall momentum direction
→ Pulse: Current Kinetic Pulse value (0-100 scale)
→ <30 = Oversold (potential long setups developing)
→ >70 = Overbought (potential short setups developing)
→ 40-60 = Neutral zone
→ Volatility: Current volatility regime (LOW, NORMAL, HIGH, EXTREME)
→ Calculated from ATR ratio vs. 100-period average
→ EXTREME volatility blocks all signals (too chaotic)
→ Trend: Market state classification
→ TREND UP / TREND DOWN: ADX > 25, directional movement clear
→ RANGING: ADX < 20, choppy conditions
→ TRANSITIONING: ADX 20-25, developing conditions
→ VOLATILE: Extreme ATR regime
→ Session: Current forex session
→ ASIAN (00:00-08:00 UTC)
→ LONDON (07:00-16:00 UTC)
→ NEW YORK (13:00-22:00 UTC)
→ LDN/NY (13:00-16:00 UTC) - Overlap period, highest volatility
→ OFF-HOURS: Outside major sessions
→ Volume: Current volume vs. 20-bar average
→ Displayed as multiplier (e.g., "1.45x" = 45% above average)
→ Green if >1.3x (high volume, bullish for signal quality)
→ Red if <0.8x (low volume, bearish for signal quality)
→ HTF: Higher timeframe analysis status
→ BULLISH: HTF momentum supports longs
→ BEARISH: HTF momentum supports shorts
→ NEUTRAL: No clear HTF direction
→ Best Score: Highest confluence score currently available
→ Shows both long and short scores
→ Format: " / "
→ Example: "8/7 " means long score is 8, threshold is 7, long is leading
→ Helps you anticipate which direction might signal next
→ PDH/PDL: Previous day high and low prices
→ Quick reference for intraday support/resistance
WHEN TRADE IS ACTIVE:
→ Trade: Direction and grade (e.g., "LONG ")
→ Entry: Entry price of current trade
→ P/L: Current profit/loss
→ Shown in ticks and R-multiples
→ Format: "+45 | +0.75R" or "-20 | -0.35R"
→ Green when positive, red when negative
→ TP1: First target status
→ Shows price and distance if not hit
→ Shows "HIT" in green if reached
→ TP2: Second target price and distance
→ Stop: Stop loss price and current distance from stop
→ Bars: Number of bars since entry (trade duration)
━━━━━━━━━━━━━━━━━━━━━━━━━━━━━━━━━━━━━━━━━━━━━━━━━━━━━━━━━━━━━━━━━━━━━━━━━━━━━
TRADE ANALYSIS PANEL (Bottom Left by default)
━━━━━━━━━━━━━━━━━━━━━━━━━━━━━━━━━━━━━━━━━━━━━━━━━━━━━━━━━━━━━━━━━━━━━━━━━━━━━
This panel provides algorithmic analysis of market conditions. It does NOT provide investment advice or recommendations.
WHEN NO TRADE IS ACTIVE:
Shows scanning status and signal readiness:
→ Long/Short Readiness Gauges
→ Visual bar showing proximity to signal threshold
→ Score display (e.g., "8/7" means 8 points scored, 7 needed)
→ "RDY" indicator when threshold reached
→ Status Messages
→ "Scanning for setups..." - Normal scanning mode
→ "Long setup ready - cooldown: X bars" - Signal qualified but in cooldown
→ "Oversold conditions - watch for reversal" - Setup developing
→ "Choppy conditions detected" - Warning about market state
→ "Extreme volatility - signals blocked" - Safety filter active
WHEN TRADE IS ACTIVE:
Header shows current analysis state:
→ FACTORS ALIGNED (Green) - Everything looks good, confidence 72+
→ POSITIVE BIAS (Light Green) - Conditions favorable, confidence 58-72
→ MIXED SIGNALS (Blue) - Neutral conditions, confidence 48-58
→ FACTORS WEAKENING (Orange) - Concerning signals, confidence 22-48
→ NEGATIVE BIAS (Red) - Poor conditions, confidence <22
Confidence Score:
→ Displayed as percentage (0-100%)
→ Visual gauge (|||||.....)
→ Trend indicator (Rising, Falling, Stable)
→ Shows momentum of confidence change
Factor Breakdown (if enabled):
Shows 6 factor categories with individual scores:
→ Momentum: Is momentum aligned with trade? (-15 to +15 points)
→ Positive if velocity matches trade direction
→ Negative if momentum opposes trade
→ Position: Current R-multiple analysis (-12 to +12 points)
→ Positive if trade is in profit
→ Negative if underwater
→ Score increases as profit grows
→ Volume: Is volume supportive? (-6 to +6 points)
→ Positive if volume above average
→ Negative if volume weak
→ HTF Align: Higher timeframe status (-6 to +8 points)
→ Positive if HTF still supports trade direction
→ Negative if HTF turned against trade
→ Target: Proximity to profit targets (0 to +10 points)
→ Higher score when approaching targets
→ Bonus if TP1 already hit and near TP2
→ Stop Dist: Distance from stop loss (-15 to +3 points)
→ Negative if dangerously close to stop (<0.3 ATR)
→ Positive if well away from stop (>1.5 ATR)
Each factor shows:
• Score value with +/- indicator
• Trend symbol: + (improving), - (deteriorating), = (stable)
• Visual gauge
Guidance Messages:
→ "TARGET 2 APPROACHING" - TP2 within 0.3 ATR
→ "TARGET 1 APPROACHING" - TP1 within 0.3 ATR
→ "STOP PROXIMITY WARNING" - Stop within 0.3 ATR
→ "Factors aligned - Holding" - Positive state, stay in trade
→ "Conditions favorable" - Still looking good
→ "Conditions mixed - " - Neutral assessment
→ "Factors deteriorating" - Warning of weakening setup
→ "Confluence weakening - secure gains" - Consider exit if profitable
COMPACT MODE (Mobile-Friendly):
→ Reduces panel size by showing only essential info
→ Factor icons instead of full breakdowns
→ Simplified guidance messages
→ Perfect for smaller screens
SETTINGS GUIDE
MASTER SETTINGS:
Instrument Type
→ Purpose: Optimizes ATR multipliers and session weights for your asset
→ Options: Auto-Detect (recommended), Forex Major, Forex Cross, Crypto, Index, Commodity
→ Default: Auto-Detect
→ When to change: If auto-detection is incorrect for your symbol
Signal Sensitivity
→ Purpose: Controls how many factors required before generating signals
→ Options:
• Conservative: Requires 12+ for A+, 9+ for A, 7+ for B (fewer, highest quality)
• Balanced: Requires 10+ for A+, 7+ for A, 5+ for B (recommended)
• Aggressive: Requires 8+ for A+, 5+ for A, 3+ for B (more frequent)
→ Default: Balanced
→ When to change: If you want fewer signals (Conservative) or more opportunities (Aggressive)
Enable Trade Signals
→ Purpose: Master on/off switch for signal generation
→ Default: ON
→ When to disable: If you only want to use the analysis dashboards without signals
Enable Trade Tracking
→ Purpose: Tracks active trades and monitors conditions until TP/SL hit
→ Default: ON
→ When to disable: If you manage trades manually and don't want automatic tracking
Show Entry/Stop/Target Levels
→ Purpose: Displays trade plan lines and labels on chart
→ Default: ON
→ When to disable: If you prefer clean charts or manage levels yourself
DISPLAY SETTINGS:
Color Theme
→ Purpose: Optimizes colors for your chart background
→ Options: Dark (for dark charts), Light (for light charts)
→ Default: Dark
Signal Display Style
→ Purpose: Visual style of signal markers
→ Options:
• Premium: Badge with line and background panel (most detailed)
• Minimal: Simple dot with grade text (cleanest)
• Classic: Diamond marker with badge (traditional)
→ Default: Premium
Signal Distance
→ Purpose: How far signal labels appear from price bars (in ATR units)
→ Range: 0.5 to 10.0
→ Default: 2.0
→ When to adjust: Increase to 3.0-4.0 if signals hide behind candle wicks
TP/SL Label Distance
→ Purpose: Spacing of price labels to prevent overlap
→ Range: 0.5 to 5.0
→ Default: 1.5
Show Previous Day Levels
→ Purpose: Display PDH/PDL reference lines
→ Default: ON
→ Best for: Intraday traders who respect previous day levels
MAIN DASHBOARD:
Show Main Dashboard
→ Purpose: Toggle visibility of market conditions table
→ Default: ON
Main Dashboard Position
→ Options: Top Right, Top Left, Bottom Right, Bottom Left
→ Default: Top Right
→ When to change: To avoid overlap with TradingView's built-in panels
TRADE ANALYSIS PANEL:
Show Trade Analysis Panel
→ Purpose: Toggle factor analysis dashboard
→ Default: ON
Analysis Panel Position
→ Options: Top Right, Top Left, Bottom Right, Bottom Left, Middle Right, Middle Left
→ Default: Bottom Left
→ Recommended: Bottom Right or Middle Right to avoid overlap with Main Dashboard
Compact Mode
→ Purpose: Reduces panel size for mobile or smaller screens
→ Default: OFF
→ When to enable: Mobile trading, small screens, or minimalist preference
Show Factor Details
→ Purpose: Displays individual factor scores vs. overall confidence only
→ Default: ON
→ When to disable: For more compact view showing only state and confidence
RISK MANAGEMENT:
Stop Loss Method
→ Purpose: How stop loss distance is calculated
→ Options:
• Structure-Based: Uses swing highs/lows with ATR buffer (recommended)
• ATR-Based: Pure ATR multiplier with min/max constraints
• Fixed ATR: Simple multiplier, no adjustments
→ Default: Structure-Based
→ Impact: Structure-Based respects market geometry but constrains within safe limits
ATR Stop Multiplier
→ Purpose: Multiplier for ATR-based stop calculation
→ Range: 0.5 to 3.0
→ Default: 1.5
→ When to adjust:
• Increase to 2.0-2.5 for more breathing room (fewer false stops)
• Decrease to 1.0-1.2 for tighter stops (but more stop-outs)
Maximum Stop Distance (ATR)
→ Purpose: Cap on stop width to prevent excessive risk
→ Range: 1.0 to 5.0
→ Default: 2.5
→ Impact: If structure-based stop exceeds this, ATR-based stop is used instead
Minimum Stop Distance (ATR)
→ Purpose: Floor on stop width to avoid noise-induced stops
→ Range: 0.2 to 1.0
→ Default: 0.5
→ Impact: Prevents stops too tight to survive normal volatility
Target 1 Risk/Reward Ratio
→ Purpose: R:R for first profit target
→ Range: 0.5 to 2.0
→ Default: 1.0 (1:1 ratio)
→ Common values: 1.0 for quick profit taking, 1.5 for patient trading
Target 2 Risk/Reward Ratio
→ Purpose: R:R for second profit target (full win)
→ Range: 1.0 to 4.0
→ Default: 2.0 (1:2 ratio)
→ Common values: 2.0-3.0 for balanced risk/reward
Minimum R:R Required
→ Purpose: Filters out signals with poor risk/reward
→ Range: 0.5 to 2.0
→ Default: 1.0
→ Impact: Signals where potential reward doesn't meet this ratio are rejected
→ WARNING: Always ensure your position sizing means a stop loss = no more than 1-2% of your account, regardless of R:R ratio
SIGNAL FILTERS:
Session Awareness
→ Purpose: Weights signals higher during major forex sessions
→ Default: ON
→ Impact: Doesn't block signals, but session quality factors into scoring
→ Best for: Forex traders
Session Timezone
→ Purpose: Timezone for session calculations
→ Options: UTC, America/New_York, Europe/London, Asia/Tokyo, Asia/Hong_Kong
→ Default: UTC
→ When to change: Match your broker's server time
Higher Timeframe Alignment
→ Purpose: Checks HTF momentum before generating signals
→ Default: ON
→ Impact: Filters counter-trend signals, improves quality
→ Recommended: Keep enabled
HTF Timeframe
→ Purpose: Which higher timeframe to check
→ Default: Auto (blank field)
→ Auto selection:
• 1m chart → 5m HTF
• 5m chart → 15m HTF
• 15m chart → 1H HTF
• 1H chart → 4H HTF
• 4H+ chart → Daily HTF
→ Manual override: Enter any timeframe (e.g., "60" for 1-hour)
Volume Confirmation
→ Purpose: Requires above-average volume for signals
→ Default: ON
→ Impact: Filters low-liquidity false signals
→ Recommended: Keep enabled
Minimum Volume Ratio
→ Purpose: Volume threshold vs. 20-bar average
→ Range: 0.3 to 2.0
→ Default: 0.8 (80% of average)
→ When to adjust:
• Increase to 1.2-1.5 for only high-volume signals
• Decrease to 0.5-0.7 for more permissive filtering
Structure Clearance Check
→ Purpose: Ensures clear path to targets (no nearby resistance/support)
→ Default: ON
→ Impact: Prevents trades with immediate obstacles
→ Recommended: Keep enabled
Minimum Bars Between Signals
→ Purpose: Cooldown period after each signal
→ Range: 1 to 10
→ Default: 3
→ Impact: After a signal, this many bars must pass before another in same direction
→ When to adjust:
• Increase to 5-7 to prevent over-trading
• Decrease to 1-2 for faster re-entries
ADVANCED TUNING:
Momentum Period
→ Purpose: Base period for Kinetic Pulse calculation
→ Range: 5 to 30
→ Default: 14
→ When to adjust:
• Lower (8-10): More responsive, noisier
• Higher (18-21): Smoother, slower to react
→ Note: If Adaptive Period enabled, this is adjusted automatically
Adaptive Period
→ Purpose: Auto-adjusts momentum period based on volatility
→ Default: ON
→ Impact: Shortens period in high volatility, lengthens in low volatility
→ Recommended: Keep enabled for automatic optimization
Divergence Lookback
→ Purpose: How far back to search for divergence patterns
→ Range: 10 to 60
→ Default: 30
→ When to adjust:
• Shorter (15-20): Only recent divergences
• Longer (40-50): Catches older divergences (may be less relevant)
Swing Detection Bars
→ Purpose: Bars required on each side to confirm swing high/low
→ Range: 2 to 7
→ Default: 3
→ Impact on stops:
• Lower (2-3): More swing points, potentially tighter stops
• Higher (5-7): Only major swings, wider stops
Choppiness Index Threshold
→ Purpose: Threshold above which market considered choppy
→ Range: 38.2 to 80.0
→ Default: 61.8
→ Impact:
• Lower (50-55): Stricter quality filter (fewer signals in ranging markets)
• Higher (65-70): More permissive (allows signals in choppier conditions)
HOW TO READ SIGNALS
SIGNAL ANATOMY:
When a signal appears, you'll see:
1. DIRECTIONAL MARKER
→ Arrow, dot, or diamond pointing to entry candle (depends on style)
→ Positioned below price for LONG, above price for SHORT
→ Connected to price with line (Premium style)
2. GRADE BADGE
→ Displays signal quality: LONG , SHORT , etc.
→ Color coding:
• Bright green/cyan for A+ longs
• Standard green for A/B longs
• Bright pink/magenta for A+ shorts
• Standard red for A/B shorts
3. ENTRY PRICE (Premium style only)
→ Shows exact entry price at signal generation
4. TOOLTIP (all styles)
→ Hover over signal to see complete trade plan
→ Includes: Entry, Stop, TP1, TP2, Risk, R:R ratios, market conditions, signal reason, confluence score
INTERPRETING GRADES:
→ A+ SIGNALS (Highest Quality)
• 8-12+ confirming factors aligned
• Multiple divergences OR strong momentum reversal
• HTF alignment + volume + session timing + clear structure
• These are your highest-probability setups
• Recommended action: Give these priority, consider larger position size
→ A SIGNALS (High Quality)
• 5-9+ confirming factors aligned
• Good confluence, most key factors present
• Missing 1-2 optimal conditions
• These are still quality trades
• Recommended action: Standard position size, solid setups
→ B SIGNALS (Moderate Quality)
• 3-7+ confirming factors aligned
• Minimum viable confluence
• May be missing HTF alignment, volume, or session timing
• Higher variance outcomes
• Recommended action: Smaller position size or skip if conservative
SIGNAL NARRATIVE:
Each signal tooltip includes a narrative explaining WHY it was generated:
→ "Multi-divergence at oversold extreme"
• Multiple oscillators showing bullish divergence
• Kinetic Pulse in oversold zone
• High-quality reversal setup
→ "Bullish divergence near support"
• Divergence detected
• Price near key support level (swing low or PDL)
• Structure confluence
→ "Momentum reversal with HTF alignment"
• Kinetic Pulse velocity reversing
• Higher timeframe supports direction
• Strong trend-following setup
→ "Oversold momentum reversal"
• Extreme Kinetic Pulse reading reversing
• May not have divergence but strong momentum shift
READING THE TRADE PLAN:
Every signal comes with a complete trade plan:
→ ENTRY: The close price of the signal candle
• This is where the signal triggered
• If using limit orders, you might improve on this price
→ STOP: Calculated stop loss level
• Based on your Stop Loss Method setting
• Distance shown in ticks
• Risk tolerance: Ensure this represents ≤1-2% of your account
→ TP1: First profit target
• Default: 1:1 risk-reward
• This is your partial profit or first exit
• Consider taking 50% off at TP1
→ TP2: Second profit target
• Default: 1:2 risk-reward
• This is your "full win" target
• Hold remaining position for this level
SIGNAL FREQUENCY EXPECTATIONS:
Frequency varies by timeframe, sensitivity, and market conditions:
→ AGGRESSIVE MODE
• Lower timeframes (1m-5m): 5-15 signals per day
• Mid timeframes (15m-1H): 2-5 signals per day
• Higher timeframes (4H-D): 1-3 signals per week
→ BALANCED MODE (Default)
• Lower timeframes: 3-8 signals per day
• Mid timeframes: 1-3 signals per day
• Higher timeframes: 2-5 signals per week
→ CONSERVATIVE MODE
• Lower timeframes: 1-4 signals per day
• Mid timeframes: 0-2 signals per day
• Higher timeframes: 1-3 signals per week
Note: Frequency also depends on market volatility and trending vs. ranging conditions.
Example - Kinetic Scalper Trade Sequence
Here's an example showing the complete trade lifecycle with all dashboard transitions, annotations, and descriptions.
INSTRUMENT & TIMEFRAME DETAILS
Symbol: Nifty 50 Index (NSE)
Date: December 15, 2025
Session: London session (active trading hours)
Instrument Type: Index (auto-detected)
TRADE SEQUENCE BREAKDOWN
SCREENSHOT 1: Pre-Signal Setup Building (Image 1)
Time: ~12:00-14:30 UTC+5:30(approx.)
Price Action: Uptrend showing signs of exhaustion near 26,200
Market State: Price at session highs
Main Dashboard (Top Right):
- Bias: LEAN SHORT
- Pulse: 58.9 (approaching overbought)
- Volatility: NORMAL
- Trend: TRANSITIONING
- Session: LONDON (favorable timing)
- Volume: 0.98x (slightly below average)
- HTF: BULLISH (caution for counter-trend)
- Best Score: 9/5 (Short score building)
- PDH/PDL: 26098.25 / 25938.95
Trade Analysis Panel (Bottom Left):
- Status: NO ACTIVE TRADE
- Long Score: 5/5 (RDY)
- Short Score: 9/5 (RDY)
- Panel Message: "Short pattern developing - score: 9"
Description :
Setup Development Phase: The indicator identifies a potential short opportunity as price reaches the previous day's high. The short confluence score has climbed to 9/15 points, meeting the 'Balanced' sensitivity threshold for a Grade B signal. Notice the 'LEAN SHORT' bias and the Kinetic Pulse reading of 58.9 approaching overbought territory. The Trade Analysis panel shows 'Short pattern developing' with 9/5 factors aligned. Key factors: momentum approaching reversal zone, price at resistance (PDH), and London session providing favorable conditions.
SCREENSHOT 2: Signal Generated & Trade Entered (Image 2)
Time: ~13:00 UTC+5:30 (signal bar)
Entry Price: 26,184.65
Signal Grade: Grade
Main Dashboard (Top Right):
- Trade: SHORT
- Entry: 26184.65
- P/L: 5.95 pts | +0.2R (early positive movement)
- TP1: 26157.00 (33.2 pts away)
- TP2: 26129.35 (60.84 pts away)
- Stop: 26212.30 (22.1 pts away)
- Bars: 1 (just entered)
Trade Analysis Panel (Bottom Left):
- Header: TRADE ANALYSIS
- Status Bar: "Conditions mixed - improving 57%"
- Confidence: 57% RISING
- Factor Breakdown:
- Momentum: -4 (velocity not yet aligned)
- Position: +4 (slight profit)
- Volume: +2 = (volume present)
- HTF Align: +2 = (not strongly aligned)
- Target: +0 - (far from TP)
- Stop Dist: +3 - (good distance)
- Bottom Status: "Conditions mixed - Monitoring"
- Disclaimer: "Analysis only - Not financial advice"
Description:
Signal Activation: A Grade A short signal triggers at 26,184.65 after the short confluence score reached qualifying levels. The indicator places a structure-based stop loss at 26,212.30 (27.65 points risk) with dual targets at 1:1 and 1:2 risk-reward ratios.
The Trade Analysis Panel immediately begins monitoring with an initial confidence score of 57% - classified as 'MIXED SIGNALS' but showing a 'RISING' trend. Factor analysis reveals: momentum not yet aligned (-4 points as price just reversed), position slightly favorable (+4 points already +0.2R), volume adequate (+2), HTF showing weak alignment (+2 as we're counter-trend), stop well-placed (+3), but targets still distant (0 points).
Notice how the Main Dashboard switches from market scanning mode to active trade tracking, now displaying entry price, live P/L in both points (5.95 pts) and R-multiples (+0.2R), and distances to all key levels. The analysis panel provides real-time factor scoring to help monitor trade health.
SCREENSHOT 3: TP1 Hit - Trade Performing Well (Image 3)
Time: ~14:20 UTC+5:30(approx)
Price: ~26,154 (TP1 zone)
Bars in Trade: 29
Main Dashboard (Top Right):
- Trade: SHORT
- Entry: 26184.65
- P/L: 30.85 pts | +1.12R (excellent progress)
- TP1: HIT (displayed in green)
- TP2: 26129.35 (24.44 pts away)
- Stop: 26212.30 (58.5 pts away - well protected)
- Bars: 29
Trade Analysis Panel (Bottom Left):
- Header: TRADE ANALYSIS
- Status Bar: "Multiple factors positive"
- Confidence: 78% RISING
- Factor Breakdown:
- Momentum: +8 = (ALIGNED)
- Position: +8 + (strong profit zone)
- Volume: +2 + (continued support)
- HTF Align: +8 = (now strongly aligned)
- Target: +10 + (TP1 achieved, approaching TP2)
- Stop Dist: +3 + (excellent cushion)
- Bottom Status: "Multiple factors positive"
- Visual State: Green background (FACTORS ALIGNED state)
Description:
Trade Execution Phase - First Target Achieved: After 29 bars , price reaches the first take-profit target at 26,157.00. The ' ' marker confirms partial profit taking. Current P/L shows +30.85 points (+1.12R), exceeding the initial 1:1 risk-reward.
The Trade Analysis Panel shows dramatic improvement - confidence has surged to 78% (FACTORS ALIGNED state) with most factors now positive:
- Momentum factor improved to +8 (velocity aligned with trade direction)
- Position factor at +8 (over +1R profit zone)
- HTF Align jumped to +8 (higher timeframe now confirming the move)
- Target factor maxed at +10 (TP1 achieved, TP2 within reach)
- Stop Distance at +3 (58.5 points cushion providing safety)
Notice the panel status displays 'Multiple factors positive' with a green-tinted background, indicating optimal trade conditions. The confidence trend shows 'RISING' suggesting continued momentum. With TP1 secured and only 24.44 points to TP2, the trade is well-positioned for a full 1:2R win.
SCREENSHOT 4: TP2 Reached - Trade Complete (Image 4)
Time: ~15:00+ UTC+5:30
Final Exit: 26,129.35 (TP2)
Final Result: Full TP2 win
Main Dashboard (Top Right):
- Bias: NEUTRAL (reverted to scanning mode)
- Pulse: 45.2 (returned to neutral zone)
- Volatility: NORMAL
- Trend: TREND DOWN (confirmed the move)
- Session: LONDON
- Volume: 1.26x (increased as move developed)
- HTF: BEARISH (fully aligned post-trade)
- Best Score: 5/5 (neutral after completion)
Trade Analysis Panel (Bottom Left):
- Status: NO ACTIVE TRADE (reverted)
- Long Score: 5/5 (RDY)
- Short Score: 5/5 (RDY)
- Panel Message: "Scanning - prime session active"
- Light blue/cyan background (back to scanning mode)
Description:
Trade Completion - Full Target Achieved: The short trade reaches its second take-profit target at 26,129.35, securing a complete 1:2 risk-reward win. The ' ' marker confirms the exit. Final results:
- Entry: 26,184.65
- Exit: 26,129.35
- Profit: 55.30 points (approximately +2.0R)
- Outcome: Full TP2 success
Post-Trade Analysis: After trade closure, the indicator automatically returns to market scanning mode. The Main Dashboard reverts to showing market conditions rather than trade metrics. Notice how the 'Trend' now displays 'TREND DOWN' - confirming the move we captured. Volume increased to 1.26x during the winning move, validating the signal quality.
The Trade Analysis Panel switches back to 'NO ACTIVE TRADE' status and resumes displaying long/short setup scores. The confidence-based factor monitoring was instrumental throughout the trade:
- Initial entry at 57% confidence (MIXED SIGNALS)
- Peak confidence of 78% at TP1 (FACTORS ALIGNED)
- Real-time factor updates helped confirm trade validity
This example demonstrates the indicator's complete workflow: setup identification → signal generation → entry execution → live trade monitoring → systematic exit at targets.
KEY FEATURES DEMONSTRATED
1. Dual Dashboard System
- Main Dashboard: Market conditions (scanning) → Trade metrics (active position)
- Analysis Panel: Setup scores (scanning) → Factor-based confidence (in-trade)
2. Visual Trade Management
- Color-coded entry zones (yellow)
- Risk levels clearly marked (red dashed stop)
- Profit targets with R:R ratios labeled
- Achievement markers ( , )
3. Real-Time Factor Analysis
- 6-factor scoring system (Momentum, Position, Volume, HTF, Target, Stop Dist)
- Confidence percentage with trend indicators
- State machine (MIXED → FACTORS ALIGNED)
- Hysteresis prevents false state changes
4. Risk Management
- Structure-based stop placement (respects swing highs)
- Multiple take-profit levels (1:1 and 1:2 R:R)
- Live P/L tracking in points and R-multiples
- Distance monitoring to all key levels
This complete example showcases the indicator's progression from setup identification through trade completion, demonstrating how the dual-dashboard system and factor-based analysis provide continuous trade guidance. The structured stop-loss and dual-target approach delivered the planned 1:2 risk-reward ratio with systematic, rule-based execution.
ALERT SYSTEM
The indicator includes 9 built-in alert conditions:
SIGNAL ALERTS:
→ High-Grade Long Signal (A+)
• Triggers only on A+ long signals
• For traders who want only the highest-quality longs
• Message: "KINETIC SCALPER: LONG @ "
→ High-Grade Short Signal (A+)
• Triggers only on A+ short signals
• For traders who want only the highest-quality shorts
• Message: "KINETIC SCALPER: SHORT @ "
→ Long Signal
• Triggers on ANY qualified long signal (A+, A, or B)
• For traders who want all long opportunities
• Message: "KINETIC SCALPER: LONG @ "
→ Short Signal
• Triggers on ANY qualified short signal
• For traders who want all short opportunities
• Message: "KINETIC SCALPER: SHORT @ "
TRADE MANAGEMENT ALERTS:
→ TP1 Hit
• Triggers when first profit target is reached
• Useful for partial profit taking notifications
• Message: "KINETIC SCALPER: TP1 REACHED"
→ TP2 Reached
• Triggers when second profit target is reached
• Trade is complete, full win achieved
• Message: "KINETIC SCALPER: TP2 REACHED"
→ Stop Loss Hit
• Triggers when stop loss is reached
• Important for trade management and risk tracking
• Message: "KINETIC SCALPER: STOP LOSS"
ANALYSIS STATE ALERTS:
→ Analysis State: Negative Bias
• Triggers when factor analysis enters "Negative Bias" state
• Warning that trade conditions are deteriorating
• Consider reducing position or preparing to exit
• Message: "KINETIC SCALPER: Analysis state changed to NEGATIVE BIAS"
→ Analysis State: Factors Weakening
• Triggers when factor analysis enters "Factors Weakening" state
• Caution that confluence is diminishing
• Monitor trade closely
• Message: "KINETIC SCALPER: Analysis state changed to FACTORS WEAKENING"
HOW TO SET UP ALERTS:
1. Click the "Create Alert" button in TradingView
2. Condition: Select "Kinetic Scalper "
3. Choose your desired alert from the dropdown
4. Configure your alert options:
→ Once Per Bar Close (recommended for non-repainting)
→ Frequency: Once Per Bar Close or Only Once
5. Set expiration and notification methods (popup, email, webhook, etc.)
6. Create alert
RECOMMENDED ALERT STRATEGY:
For active traders:
→ Set "Long Signal" and "Short Signal" alerts for all opportunities
→ Set "TP1 Hit", "TP2 Reached", and "Stop Loss Hit" for trade management
→ Consider "Analysis State: Negative Bias" for trade monitoring
For selective traders:
→ Set only "High-Grade Long Signal (A+)" and "High-Grade Short Signal (A+)"
→ Focus on the absolute highest-quality setups
→ Set TP/SL alerts for position management
USAGE TIPS & BEST PRACTICES
SIGNAL SELECTION:
✓ GRADE MATTERS
→ A+ signals have statistically more confluence factors
→ If you're conservative, trade only A+ signals
→ B signals can work but require more discretion
✓ CONFLUENCE WITH YOUR ANALYSIS
→ Use this indicator as CONFIRMATION, not sole decision criteria
→ Combine with your own support/resistance analysis
→ Check for fundamental events (news, economic data)
→ Respect major round numbers and psychological levels
✓ SESSION TIMING (Forex)
→ Best signals often occur during London/NY overlap
→ Avoid signals 10 minutes before major news releases
→ Asian session signals can be valid but lower liquidity
✓ TIMEFRAME CONFLUENCE
→ If you get an A+ signal on 15m, check if 1H chart agrees
→ Higher timeframe confirmation adds conviction
→ Avoid signals that oppose the daily/4H trend
TRADE MANAGEMENT:
✓ POSITION SIZING
→ ALWAYS size positions so stop loss = 1-2% of account
→ Never risk more than you can afford to lose
→ Smaller position on B signals, standard on A, larger on A+ (within limits)
✓ PARTIAL PROFIT TAKING
→ Consider taking 50% off at TP1
→ Move stop to breakeven after TP1 hit
→ Let remaining position run to TP2
✓ TRAILING STOPS
→ The indicator doesn't auto-trail stops (manual decision)
→ After TP1, you might manually move stop to entry (breakeven)
→ Consider ATR-based trailing stop for runners
✓ WATCH THE ANALYSIS PANEL
→ If state changes to "Factors Weakening" while in profit, consider exit
→ "Negative Bias" during a trade is a strong warning
→ "Factors Aligned" confirms your trade thesis is still valid
RISK MANAGEMENT:
✓ NEVER IGNORE STOPS
→ The calculated stop is there for a reason
→ Moving stop further away increases risk exponentially
→ If stopped out, accept it and wait for next setup
✓ AVOID REVENGE TRADING
→ If you get stopped out, resist urge to immediately re-enter
→ Signal cooldown helps with this
→ Wait for next qualified signal
✓ RESPECT VOLATILITY WARNINGS
→ If indicator shows "EXTREME" volatility, signals are blocked for a reason
→ Don't force trades in chaotic conditions
→ Wait for regime to normalize
✓ CORRELATION RISK
→ Be aware of correlation if trading multiple pairs
→ EUR/USD and GBP/USD are highly correlated
→ Don't stack risk on correlated instruments
OPTIMIZATION:
✓ START WITH DEFAULTS
→ Default settings are well-tested
→ Don't over-optimize for recent market behavior
→ Give settings at least 20-30 trades before judging
✓ TIMEFRAME-SPECIFIC ADJUSTMENTS
→ Lower timeframes: Consider increasing Signal Distance to 3.0-4.0
→ Higher timeframes: ATR Stop Multiplier might go to 2.0-2.5
→ Crypto: Ensure Instrument Type is set to "Crypto" for proper stops
✓ SENSITIVITY CALIBRATION
→ Too many signals? Switch to Conservative
→ Missing good setups? Try Balanced or Aggressive
→ Quality > Quantity always
✓ KEEP A JOURNAL
→ Track which signal grades work best for you
→ Note which sessions produce best results
→ Review stopped trades for patterns
THINGS TO AVOID:
✗ DON'T chase signals after several bars have passed
✗ DON'T ignore the stop loss or move it further away
✗ DON'T overtrade by taking every B-grade signal
✗ DON'T trade during major news if you're not experienced
✗ DON'T use this as your only analysis tool
✗ DON'T expect 100% win rate (no indicator has this)
✗ DON'T risk more than 1-2% per trade regardless of signal grade
UNDERSTANDING THE METHODOLOGY
WHY VOLUME WEIGHTING?
Traditional momentum oscillators treat all price moves equally. A 10-point move on low volume is weighted the same as a 10-point move on high volume.
The Kinetic Pulse corrects this by:
→ Calculating volume ratio vs. 20-bar average
→ Applying square root transformation to volume ratio (prevents extreme weights)
→ Multiplying price changes by volume weight
→ Result: High-volume moves influence the oscillator more than low-volume noise
This helps filter false breakouts and emphasizes moves with participation.
WHY FISHER TRANSFORM?
Fisher Transform is a mathematical transformation that:
→ Normalizes probability distributions
→ Creates sharper turning points
→ Amplifies extremes while compressing the middle
→ Makes overbought/oversold levels more distinct
Applied to the Kinetic Pulse, it helps identify genuine extremes vs. noise.
WHY MULTI-OSCILLATOR DIVERGENCE?
Single-source divergence can give false signals. By requiring divergence confirmation across multiple oscillators (Kinetic Pulse, CCI, Stochastic), the system filters out:
→ Divergences caused by calculation quirks in one oscillator
→ Temporary momentum anomalies
→ False divergence on noisy, low-timeframe charts
Multiple sources confirming the same pattern increases reliability.
WHY ADAPTIVE PERIODS?
Fixed periods can be:
→ Too slow during high volatility (miss fast reversals)
→ Too fast during low volatility (generate noise)
The adaptive system:
→ Shortens period when ATR ratio > 1.3 (high volatility = need faster response)
→ Lengthens period when ATR ratio < 0.7 (low volatility = need noise filtering)
→ Keeps period in reasonable range (60% to 140% of base period)
→ Result: Oscillator adjusts to current market pace automatically
WHY HYSTERESIS IN STATE MACHINE?
Without hysteresis, the analysis state would flip-flop on every bar, creating:
→ Confusing, contradictory guidance
→ Analysis paralysis
→ Lack of actionable information
Hysteresis solves this by:
→ Using different thresholds to ENTER vs. EXIT a state
→ Example: Enter "Factors Aligned" at 72+ confidence, but don't exit until <62
→ This creates stable states that persist through minor fluctuations
→ Requires minimum commitment period (3 bars) before state changes
→ Overrides commitment for significant events (near TP/SL)
→ Result: Stable, trustworthy analysis that changes only when truly warranted
WHY CONFIDENCE SMOOTHING?
Raw factor scores fluctuate bar-by-bar based on momentary conditions. Smoothing:
→ Uses 5-period EMA on raw confidence scores
→ Filters out single-bar anomalies
→ Preserves genuine trends in confidence
→ Prevents false state transitions
→ Result: More reliable assessment of actual trade health
WHY INSTRUMENT-SPECIFIC PARAMETERS?
Different instruments have different characteristics:
→ Forex is highly liquid, respects technical levels well, standard ATR works
→ Crypto is extremely volatile, needs wider stops (1.8x) to avoid false stops
→ Indices respect session opens strongly, session weighting is important
→ Commodities fall in between
Auto-detection applies research-based multipliers automatically.
WHY STRUCTURE-BASED STOPS?
ATR-based stops can:
→ Place stop in middle of consolidation (easily hit)
→ Ignore obvious invalidation levels
→ Be too tight during expansion or too wide during contraction
Structure-based stops:
→ Use actual swing highs/lows (where traders actually place stops)
→ Add small ATR buffer to avoid stop hunting
→ Constrain within min/max ATR limits for safety
→ Result: Stops that respect market geometry while managing risk
DISCLAIMER & RISK WARNING
READ THIS CAREFULLY BEFORE USING THIS INDICATOR
This indicator is provided for EDUCATIONAL and INFORMATIONAL purposes only.
❌ NOT FINANCIAL ADVICE
This indicator does NOT constitute financial advice, investment recommendations, or solicitation to buy or sell any financial instrument. All information is for educational purposes only.
❌ NO GUARANTEES
→ Past performance does NOT guarantee future results
→ No indicator can predict future price movements with certainty
→ Signal grades represent confluence, NOT win probability
→ A+ signals can lose, B signals can win - markets are probabilistic
❌ SUBSTANTIAL RISK
Trading financial instruments involves SUBSTANTIAL RISK of loss:
→ You can lose your entire investment
→ Leveraged trading amplifies both gains AND losses
→ Never trade with money you cannot afford to lose
→ Never risk more than 1-2% of your account per trade
❌ YOUR RESPONSIBILITY
→ All trading decisions are YOUR responsibility
→ You must conduct your own analysis before entering trades
→ Consult a licensed financial advisor before trading
→ Understand the risks specific to your jurisdiction and situation
→ Only trade with capital you can afford to lose completely
❌ NO HOLY GRAIL
→ This indicator is a TOOL, not a complete trading system
→ It should be used as part of a broader analysis framework
→ Combine with your own technical analysis, risk management, and judgment
→ No indicator works 100% of the time in all market conditions
❌ ANALYSIS PANEL DISCLAIMER
The "Trade Analysis Panel" provides ALGORITHMIC ANALYSIS of market factors.
→ It does NOT provide investment advice or recommendations
→ Factor scores are mathematical calculations, not predictions
→ Guidance messages are informational, not directives
→ All trading decisions remain your responsibility
❌ BACKTESTING LIMITATIONS
→ This is an indicator, not a strategy, so no backtesting results are provided
→ Any backtesting you perform includes hindsight bias and optimization bias
→ Historical performance does not indicate future performance
→ Slippage, commissions, and real-world execution differ from backtests
❌ MARKET CONDITIONS
→ This indicator performs differently in trending vs. ranging markets
→ Extreme volatility can produce false signals or whipsaws
→ Low liquidity periods increase execution risk
→ Major news events can invalidate technical analysis
BY USING THIS INDICATOR, YOU ACKNOWLEDGE:
→ You have read and understood this disclaimer
→ You accept full responsibility for your trading decisions
→ You understand the substantial risks involved in trading
→ You will not hold the author liable for any losses incurred
→ You are using this tool as part of your own due diligence process
KEY FEATURES SUMMARY
✅ Volume-Weighted Kinetic Pulse Engine (proprietary momentum calculation)
✅ 15-Factor Confluence Scoring System (graded signals: A+, A, B)
✅ Multi-Oscillator Divergence Detection (Pulse + CCI + Stochastic)
✅ Higher Timeframe Trend Alignment Filter
✅ Adaptive Period Adjustment (volatility-responsive)
✅ Instrument-Aware Calibration (Forex, Crypto, Indices, Commodities)
✅ Structure-Based Stop Loss Calculation (respects swing highs/lows)
✅ Automated Trade Tracking (entry, stop, TP1, TP2, P/L)
✅ Real-Time Factor Analysis State Machine (5-state system with hysteresis)
✅ Session Awareness (Asian, London, New York, Overlap)
✅ Volatility Regime Detection (blocks signals in extreme conditions)
✅ Choppiness Filter (reduces signals in ranging markets)
✅ Volume Confirmation (relative volume and delta analysis)
✅ Clean Air Check (validates clear path to targets)
✅ Comprehensive Dashboards (market conditions + trade analysis)
✅ Customizable Display (3 signal styles, color themes, positioning)
✅ 9 Built-In Alert Conditions (signals, TP/SL hits, state changes)
✅ Fully Non-Repainting (barstate.isconfirmed, lookahead_off)
✅ Previous Day Levels (PDH/PDL reference lines)
✅ Mobile-Friendly Compact Mode (for smaller screens)
TECHNICAL SPECIFICATIONS
→ Pine Script Version: v6
→ Indicator Type: Overlay (displays on price chart)
→ License: Mozilla Public License 2.0
→ Copyright: BULLBYTE
→ Object Limits: 300 labels, 100 lines, 50 boxes
→ Memory Management: Automatic cleanup system (FIFO queue)
→ Repainting: Non-repainting (signals confirmed on bar close)
→ Timeframe Support: All timeframes (1s to Monthly)
→ Instrument Support: Forex, Crypto, Indices, Commodities, Stocks
→ HTF Data Handling: lookahead_off with historical offset
VERSION HISTORY
v1.0 - Initial Release
→ Kinetic Pulse engine with volume weighting and Fisher Transform
→ 15-factor confluence scoring system
→ Trade analysis state machine with hysteresis
→ Automated trade tracking and monitoring
→ Dual dashboard system (market conditions + factor analysis)
→ 9 alert conditions
→ 3 signal display styles
→ Instrument-aware calibration
→ Full risk management framework
WHO IS THIS INDICATOR FOR?
IDEAL FOR:
✓ Scalpers and day traders seeking high-confluence reversal entries
✓ Swing traders who want quality over quantity
✓ Traders who appreciate systematic, rules-based analysis
✓ Multi-timeframe traders who value HTF confirmation
✓ Forex traders who respect session timing
✓ Crypto traders needing volatility-adjusted parameters
✓ Traders who want complete trade management (entry, stop, targets)
✓ Analytical traders who want transparency in signal generation
NOT IDEAL FOR:
✗ Traders seeking a "set and forget" holy grail system
✗ Traders who don't want to learn the methodology
✗ Traders unwilling to accept losing trades as part of the process
✗ Traders who need constant signals (this is a quality-focused system)
✗ Traders who ignore risk management
FINAL THOUGHTS
The Kinetic Scalper is the result of extensive research into momentum behavior, volume confirmation, and multi-factor confluence analysis. It's designed to identify high-probability reversal setups while maintaining strict risk management and providing complete transparency.
This is NOT a magic solution. It's a sophisticated TOOL that requires:
→ Understanding of the methodology
→ Proper risk management discipline
→ Patience to wait for quality setups
→ Willingness to accept losses as part of trading
→ Integration with your own analysis and judgment
Used properly as part of a complete trading plan, the Kinetic Scalper can help you identify high-confluence opportunities and manage trades systematically.
Remember: Quality over quantity. Discipline over emotion. Risk management over everything.
Trade smart. Trade safe.
© 2025 BULLBYTE | Kinetic Scalper v1.0 | For Educational Purposes Only
Oscillateurs

Relative Strength Index_YJ//@version=5
indicator(title="MACD_YJ", shorttitle="MACD_YJ",format=format.price, precision=2)
source = close
useCurrentRes = input.bool(true, title="Use Current Chart Resolution?")
resCustom = input.timeframe("60", title="Use Different Timeframe? Uncheck Box Above")
smd = input.bool(true, title="Show MacD & Signal Line? Also Turn Off Dots Below")
sd = input.bool(false, title="Show Dots When MacD Crosses Signal Line?")
sh = input.bool(true, title="Show Histogram?")
macd_colorChange = input.bool(true, title="Change MacD Line Color-Signal Line Cross?")
hist_colorChange = input.bool(true, title="MacD Histogram 4 Colors?")
// === Divergence inputs ===
grpDiv = "Divergence"
calculateDivergence = input.bool(true, title="Calculate Divergence", group=grpDiv, tooltip="피벗 기반 정/역배 다이버전스 탐지 및 알람 사용")
lookbackRight = input.int(5, "Lookback Right", group=grpDiv, minval=1)
lookbackLeft = input.int(5, "Lookback Left", group=grpDiv, minval=1)
rangeUpper = input.int(60, "Bars Range Upper", group=grpDiv, minval=1)
rangeLower = input.int(5, "Bars Range Lower", group=grpDiv, minval=1)
bullColor = input.color(color.new(#4CAF50, 0), "Bull Color", group=grpDiv)
bearColor = input.color(color.new(#F23645, 0), "Bear Color", group=grpDiv)
textColor = color.white
noneColor = color.new(color.white, 100)
res = useCurrentRes ? timeframe.period : resCustom
fastLength = input.int(12, minval=1)
slowLength = input.int(26, minval=1)
signalLength= input.int(9, minval=1)
fastMA = ta.ema(source, fastLength)
slowMA = ta.ema(source, slowLength)
macd = fastMA - slowMA
signal = ta.sma(macd, signalLength)
hist = macd - signal
outMacD = request.security(syminfo.tickerid, res, macd)
outSignal = request.security(syminfo.tickerid, res, signal)
outHist = request.security(syminfo.tickerid, res, hist)
// 가격도 같은 res로
hi_res = request.security(syminfo.tickerid, res, high)
lo_res = request.security(syminfo.tickerid, res, low)
// ── Histogram 색
histA_IsUp = outHist > outHist and outHist > 0
histA_IsDown = outHist < outHist and outHist > 0
histB_IsDown = outHist < outHist and outHist <= 0
histB_IsUp = outHist > outHist and outHist <= 0
macd_IsAbove = outMacD >= outSignal
plot_color = hist_colorChange ? (histA_IsUp ? color.new(#00FF00, 0) :
histA_IsDown ? color.new(#006900, 0) :
histB_IsDown ? color.new(#FF0000, 0) :
histB_IsUp ? color.new(#670000, 0) : color.yellow) : color.gray
macd_color = macd_colorChange ? color.new(#00ffff, 0) : color.new(#00ffff, 0)
signal_color = color.rgb(240, 232, 166)
circleYPosition = outSignal
// 골든/데드 크로스 (경고 해결: 먼저 계산)
isBullCross = ta.crossover(outMacD, outSignal)
isBearCross = ta.crossunder(outMacD, outSignal)
cross_color = isBullCross ? color.new(#00FF00, 0) : isBearCross ? color.new(#FF0000, 0) : na
// ── 플롯
plot(sh and outHist ? outHist : na, title="Histogram", color=plot_color, style=plot.style_histogram, linewidth=5)
plot(smd and outMacD ? outMacD : na, title="MACD", color=macd_color, linewidth=1)
plot(smd and outSignal? outSignal: na, title="Signal Line", color=signal_color, style=plot.style_line, linewidth=1)
plot(sd and (isBullCross or isBearCross) ? circleYPosition : na,
title="Cross", style=plot.style_circles, linewidth=3, color=cross_color)
hline(0, "0 Line", linestyle=hline.style_dotted, color=color.white)
// =====================
// Divergence (정배/역배) - 피벗 비교
// =====================
_inRange(cond) =>
bars = ta.barssince(cond)
rangeLower <= bars and bars <= rangeUpper
plFound = false
phFound = false
bullCond = false
bearCond = false
macdLBR = outMacD
if calculateDivergence
// 정배: 가격 LL, MACD HL
plFound := not na(ta.pivotlow(outMacD, lookbackLeft, lookbackRight))
macdHL = macdLBR > ta.valuewhen(plFound, macdLBR, 1) and _inRange(plFound )
lowLBR = lo_res
priceLL = lowLBR < ta.valuewhen(plFound, lowLBR, 1)
bullCond := priceLL and macdHL and plFound
// 역배: 가격 HH, MACD LH
phFound := not na(ta.pivothigh(outMacD, lookbackLeft, lookbackRight))
macdLH = macdLBR < ta.valuewhen(phFound, macdLBR, 1) and _inRange(phFound )
highLBR = hi_res
priceHH = highLBR > ta.valuewhen(phFound, highLBR, 1)
bearCond := priceHH and macdLH and phFound
// 시각화 (editable 파라미터 삭제)
plot(plFound ? macdLBR : na, offset=-lookbackRight, title="Regular Bullish (MACD)",
linewidth=2, color=(bullCond ? bullColor : noneColor), display=display.pane)
plotshape(bullCond ? macdLBR : na, offset=-lookbackRight, title="Bullish Label",
text=" Bull ", style=shape.labelup, location=location.absolute, color=bullColor, textcolor=textColor, display=display.pane)
plot(phFound ? macdLBR : na, offset=-lookbackRight, title="Regular Bearish (MACD)",
linewidth=2, color=(bearCond ? bearColor : noneColor), display=display.pane)
plotshape(bearCond ? macdLBR : na, offset=-lookbackRight, title="Bearish Label",
text=" Bear ", style=shape.labeldown, location=location.absolute, color=bearColor, textcolor=textColor, display=display.pane)
// 알람
alertcondition(bullCond, title="MACD Regular Bullish Divergence",
message="MACD 정배 다이버전스 발견: 현재 봉에서 lookbackRight 만큼 좌측.")
alertcondition(bearCond, title="MACD Regular Bearish Divergence",
message="MACD 역배 다이버전스 발견: 현재 봉에서 lookbackRight 만큼 좌측.")

1 CMO200 Signals.Multiple Instrument ScreenerDescription
CMO200 Signals is an overlay indicator that combines a volume-based breakout signal system with multi-timeframe Support/Resistance levels and a 30-symbol screener table.
What it does:
Plots volume-driven BUY/SELL labels on the chart using three lookback presets: 200 / 388 / 500.
Builds higher-timeframe Support & Resistance lines using RSI + CMO conditions and pivot logic (configurable S/R timeframe).
Shows a multi-instrument screener table (up to 30 symbols) with each symbol’s RSI, current BUY/SELL status, last signal price, and trend bias vs MA 200 / MA 111 / MA 89.
Includes alerts for: BUY/SELL (200 lookback) and price crossing above/below MA200.
Inputs: RSI length, lookback settings, Less Ratio filter, S/R timeframe, and symbol enable toggles.
Disclaimer: This script is for educational/informational purposes only and is not financial advice. Always use proper risk management and confirm signals with additional analysis.

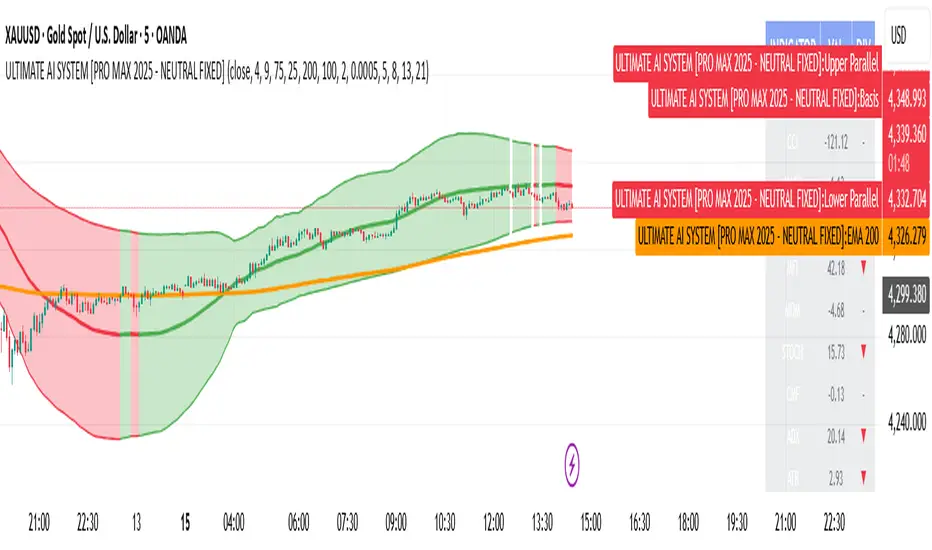
ULTIMATE AI SYSTEM [PRO MAX 2025 - NEUTRAL FIXED]🚀 Overview
The ULTIMATE AI SYSTEM is a next-generation trading toolkit designed to identify high-probability reversal setups within established trends. This Parallel Edition introduces a dynamic Linear Regression Channel combined with a powerful Multi-Divergence Engine capable of scanning 14 different oscillators simultaneously.
🔥 Key Features
1. Parallel Linear Regression Channel
This is the core of the trend filtering system. Unlike standard regression channels:
• Parallel Bands: The upper and lower bands are perfectly parallel to the baseline, calculated using Standard Deviation (Deviation 2.0 default).
• Dynamic Trend Coloring: The channel automatically changes color based on the slope:
• 🟢 Green: Uptrend (Bullish Bias)
• 🔴 Red: Downtrend (Bearish Bias)
• Mean Reversion Logic: It helps filter out trades that are over-extended (e.g., buying at the top of the channel).
2. AI Multi-Divergence Engine
The script scans 14 Indicators simultaneously across Fibonacci Lookback Periods (5, 8, 13, 21 candles) to find hidden momentum shifts.
• Indicators Scanned: RSI, CCI, MACD, OBV, MFI, MOM, STOCH, CMF, ADX, ATR, WPR, ROC, TSI.
• Algorithm: A signal is only triggered if a user-defined minimum number of indicators (default: 4) show divergence at the same time.
3. Smart Filtering Layer
To reduce false signals, every trade must pass 5 layers of confirmation:
1. Trend Filter: Price must be above/below the EMA 200 (optional).
2. Regression Filter: Buy signals are validated only if price is within the safe zone of the Linear Regression Channel.
3. RSI Guard: Prevents buying in Overbought or selling in Oversold conditions (optimized 75/25 levels).
4. Candle Validation: Buys require a Green candle; Sells require a Red candle.
5. Lookback Confirmation: Uses Fibonacci sequences to validate divergence strength.
4. Pro Dashboard
A real-time table on the chart displays:
• Current value of all oscillators.
• Live Divergence status (▲ for Bullish, ▼ for Bearish).
• Overall Market Sentiment score.
🛠 How It Works
• LONG (BUY) Signal:
1. Market Sentiment is Bullish (Minimum 4 indicators showing bullish divergence).
2. Price is above EMA 200 (Trend Confirmation).
3. Linear Regression Slope is Positive (or price is at the channel bottom).
4. RSI is below 75 (Not Overbought).
5. Candle closes Green.
• SHORT (SELL) Signal:
1. Market Sentiment is Bearish (Minimum 4 indicators showing bearish divergence).
2. Price is below EMA 200 (Trend Confirmation).
3. Linear Regression Slope is Negative (or price is at the channel top).
4. RSI is above 25 (Not Oversold).
5. Candle closes Red.
⚙️ Settings
• Min Confirmations: Number of indicators required to trigger a signal (Default: 4).
• Regression Length: Length for the Linear Regression Channel (Default: 100).
• Channel Deviation: Width of the parallel channel (Default: 2.0).
• EMA Filter: Toggle EMA 200 filtering On/Off.
• Lookback Periods: Customizable Fibonacci sequence for divergence detection.
⚠️ Disclaimer
This script is for educational and analytical purposes only. No indicator guarantees 100% accuracy. Always use proper risk management and combine signals with your own price action analysis.
Code Author:
Version: PRO MAX 2025 - PARALLEL EDITION
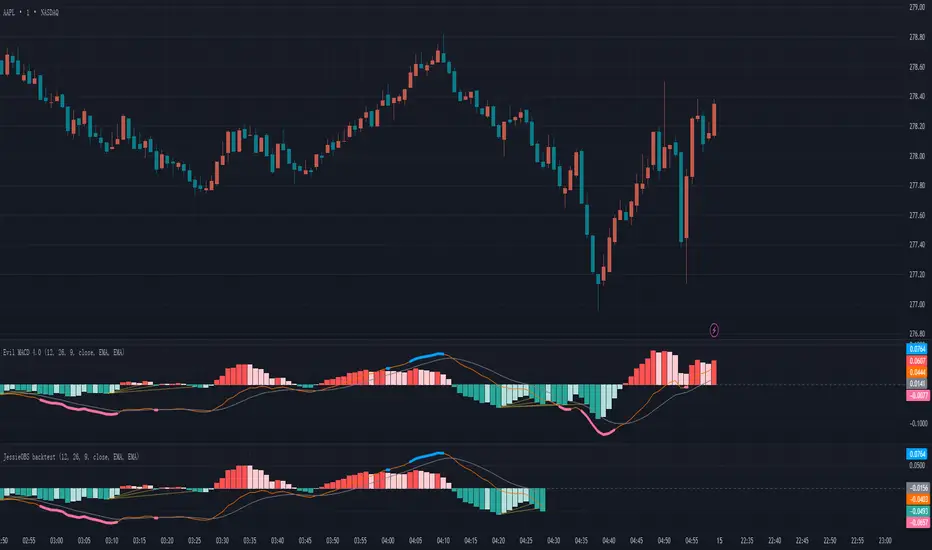
JessieOBS The Evil MACD for back testingJessieOBS – Reversal Early Warning Tool (Backtest Version)
1. Reversal Early Warning
This indicator highlights areas with the highest probability of trend reversal using thick red and blue lines.
Blue lines indicate a potential downward reversal
Red lines indicate a potential upward reversal
Instead of marking a single point, JessieOBS focuses on identifying high-probability reversal zones.
2. Sideways Market Filtering
One major weakness of many traditional indicators is their inability to filter out sideways (range-bound) markets.
JessieOBS is designed to address this issue: during consolidation phases, red and blue warning zones appear far less frequently, helping traders avoid low-quality signals and reduce noise.
3. Left-Side Signal for Advanced Analysis
JessieOBS is a left-side indicator, meaning it provides early warnings before confirmation.
Signals are often shown as a zone rather than a precise entry point. To refine entries, users are encouraged to combine JessieOBS with their own trading systems, such as:
Divergence-based strategies
Smart Money Concepts (SMC) analysis
The Theory of Entanglement structures
Different traders use different methods, and JessieOBS works as a powerful tool to enhance the accuracy and confidence of many analytical approaches.
4. Backtesting-Focused Version
This version is specifically designed for historical analysis and backtesting.
Recent data is intentionally hidden, while historical signals remain visible, making it suitable for building, evaluating, and refining trading systems.
5. Real-Time Signals
For real-time trading signals, please refer to JessieOBS with MACD – The Evil MACD 3.0.

JAM ALGO Signals
"Remove the filters to view signals, then customize the parameters to your preference and enjoy using the indicator!" ✅
JAM ALGO Signals
Description:
🚀 Advanced Trading Signals with Risk Management & Alerts
This indicator is a complete all-in-one tool for traders seeking precise entries and exits with built-in risk management and real-time statistics. It combines RSI and EMA-based analysis, projected Take Profit (TP) and Stop Loss (SL) levels, customizable filters, and premium alerts directly on your TradingView chart.
✨ Key Features:
Entry Signals 🔹
Buy & Sell signals based on price action and RSI conditions.
Trend confirmation via EMA (200 and optional 50-period filters).
Visual signals: Labels, Arrows, Triangles, or Text.
Risk Management (RR) ⚖️
Define Stop Loss (SL) and multiple Take Profit levels (TP1, TP2, TP3) based on risk ratio (R).
Configurable projection bars to visualize target levels.
Colored zones for TP & SL, with optional borders for clarity.
Premium Alerts 🔔
Alerts for BUY / SELL signals, TP1 / TP2 / TP3, and SL hits.
Instant notifications when levels are reached.
Advanced Filters 🛡️
EMA50 Trend Filter: confirms short-term trend.
RSI Direction Filter: ensures momentum alignment.
Volatility Filter (ATR14 > Range): ensures enough market movement.
Candle Size Filter: avoids entries on too small candles.
SL Overlap Filter: prevents trades overlapping existing SL levels.
Real-Time Statistics 📊
Total trades, wins (TP1), and losses (SL).
Winrate (%), cumulative profit, and average RR ratio.
Optimizes strategy tracking directly on the chart.
Customizable Visuals 🎨
TP & SL line colors and styles (solid, dashed, dotted).
Fully adjustable signal labels (color, size, type).
Configurable stats table with background & text colors.
🔥 Advantages:
Complete tool for day trading and swing trading.
Clear visualization of critical risk/reward levels.
Automatic alerts for fast reaction without constant monitoring.
Integrated statistics for performance evaluation and strategy improvement.
Recommended for:
Traders using price action, intraday strategies, scalping, or swing trading, who want advanced risk management with visual signals and performance analytics on TradingView.

RRG 1 stockThis Pine Script combines Relative Rotation Graph (RRG) analysis with Supertrend-based trend confirmation to identify momentum shifts and potential trade entries in a single stock relative to a benchmark (e.g., NIFTY). Here’s a detailed description you can use:
Description – RRG + Supertrend Indicator (1 Stock)
The RRG 1 Stock indicator blends relative strength analysis with trend-following confirmation to help traders pinpoint when a stock is outperforming or underperforming its benchmark and to align entries with trend direction.
Core logic:
Benchmark-relative strength (RS-Ratio and RS-Momentum):
Calculates relative strength (RS) of the selected stock versus a benchmark (default: NIFTY).
Applies double smoothed Weighted Moving Averages (WMA) to derive normalized RS-Ratio and RS-Momentum, similar to Julius de Kempenaer’s RRG framework.
Classifies each bar into one of four RRG quadrants:
Leading – strong and improving relative performance
Weakening – losing momentum after leadership
Lagging – underperforming the benchmark
Improving – rebounding from underperformance
The chart background color dynamically reflects the current quadrant.
Supertrend filters (Trend confirmation):
Uses two Supertrend overlays with different multipliers (Factor1, Factor2) to judge trend strength.
Potential long setups occur when the stock is in the Leading quadrant and price is above both Supertrends.
Potential short setups occur when in the Lagging quadrant and price lies below both Supertrends.
Velocity and momentum signals:
Measures RRG “velocity” — the speed of movement across the RS-Ratio/RS-Momentum plane.
Flags unusually strong rotations (high velocity) with a diamond marker when momentum accelerates.
Statistical bands & entry modes:
Standard-deviation bands on RS-Ratio (±2σ by default) can be used for mean-reversion entries if you select STDDEV mode instead of QUADRANT.
Shows fast RS moving average (9-period) as a smoother for momentum confirmation.
Custom time markers:
You can define a specific date (day, month, year) to analyze RRG values at that time and display the difference in bar count since that point.
Visualization:
Plots RS-Ratio (green) and RS-Momentum (blue) with a 100 baseline.
Benchmark and stock closing prices appear in the status line.
Chart background colors shift to reflect RRG quadrant and trend direction.
Usage:
Ideal for relative strength rotation analysis or as a systematic entry trigger in momentum-based strategies. It helps confirm trend continuation or reversals based on both relative momentum and technical trend strength.

Dual Momentum Confluence Oscillator MACD + RSIThis indicator is built around the **simultaneous use of two complementary momentum perspectives**, designed to be read **together**, not in isolation.
### Core purpose
* Highlight moments where **momentum agreement** or **momentum imbalance** becomes visually evident.
* Help distinguish between **healthy movement**, **loss of strength**, and **potential transition phases**.
### Combined reading approach
* One component focuses on **momentum flow and acceleration**, showing how force develops or fades.
* The other evaluates **relative pressure within recent price action**, adding context to whether momentum is stretched or still balanced.
* Signals are meant to be interpreted when **both perspectives are considered at the same time**, reinforcing or filtering each other.
### Practical use
* Particularly useful as a **confirmation layer** for directional strategies.
* Helps avoid decisions based on a single momentum measure by requiring **contextual alignment**.
* Can also support timing refinement in both continuation and pullback scenarios.
### Visual structure
* Everything is displayed in **one compact pane**, allowing quick cross-market scanning without overloading the chart.
* Visual contrast makes changes in momentum state easy to spot at a glance.
### Best conditions
* Most effective in markets with **clear participation and readable momentum shifts**.
* Less informative during flat, low-energy phases.
*For educational and analytical purposes only. Always test across multiple markets and timeframes.*
---
Così è chiaro che **RSI e MACD lavorano insieme**, ma **nessuno può risalire a come**.

ADX CornerShows the current ADX value along with the average ADX over the last N candles in a small table on the chart.
It’s meant as a quick reference to see whether the market is generally trending or stuck in chop, without needing a separate indicator pane.

Trading Asset Comparison Oscillator by thedatalayers.comThe Trading Asset Comparison Oscillator compares the currently opened asset with a user-selected reference symbol to identify periods of relative overvaluation and undervaluation.
The concept is based on the idea that markets constantly seek fair value. When an asset becomes mispriced relative to a meaningful benchmark, it often moves back toward equilibrium.
This indicator measures that relationship and transforms it into an easy-to-read oscillator:
• Green Zone (Undervalued) - The selected asset is undervalued compared to the reference symbol.
This reflects potential upward pressure as markets tend to correct undervaluation over time.
• Red Zone (Overvalued) - The asset is overvalued relative to the reference symbol.
This may indicate a higher likelihood of downward movement as price seeks rebalancing.
Users can set any reference instrument they consider relevant-commodities, indices, currency pairs, or other assets. The oscillator quantifies the valuation difference based on a configurable cycle length.
The recommended setting is Cycle = 10, which provides a balanced and responsive signal
structure.
Since this indicator relies on broader valuation dynamics, it is designed to be used exclusively on the daily timeframe. Lower timeframes may not reflect true fundamental value relationships.
The Asset Comparison Oscillator helps traders identify when an asset appears cheap or expensive relative to another, offering an additional layer of fundamental context to support directional trading decisions.
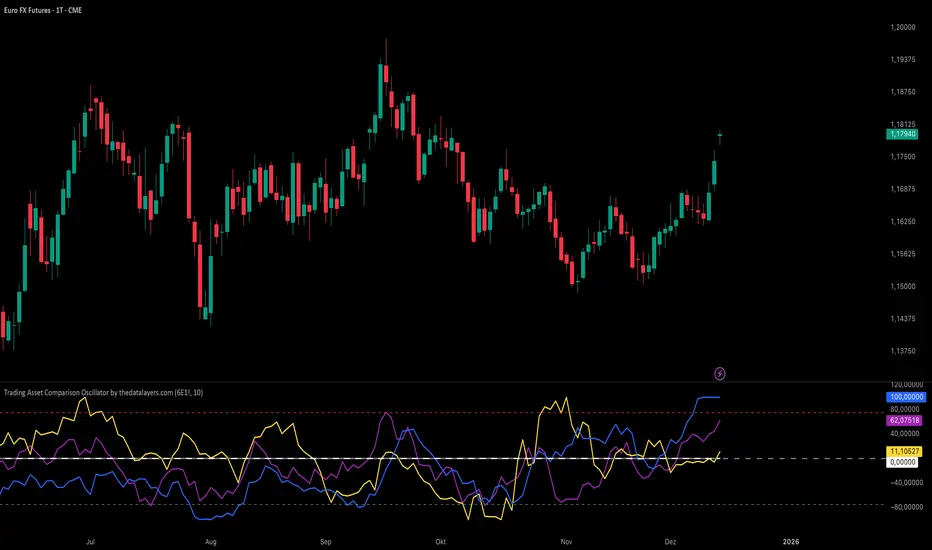
Momentum Quality Index (MQI)
Welcome to the Momentum Quality Index! This indicator aims to provide insight into short term trends by measuring the efficiency of price movement relative to the momentum of the trend. This indicator is designed to work better on short term time frames, capturing the micro-level of trends for practices such as day-trading, options trading, and shorter term swing trading.
How to read:
The main way of reading this indicator is through moving average crossovers. Upwards crossovers indicates uptrends whereas downwards crossovers indicates downtrends.
Customization:
This indicator includes a few adjustable options for fine tuning, such as optimized smoothing options and moving average length for efficiency in spotting reversals.
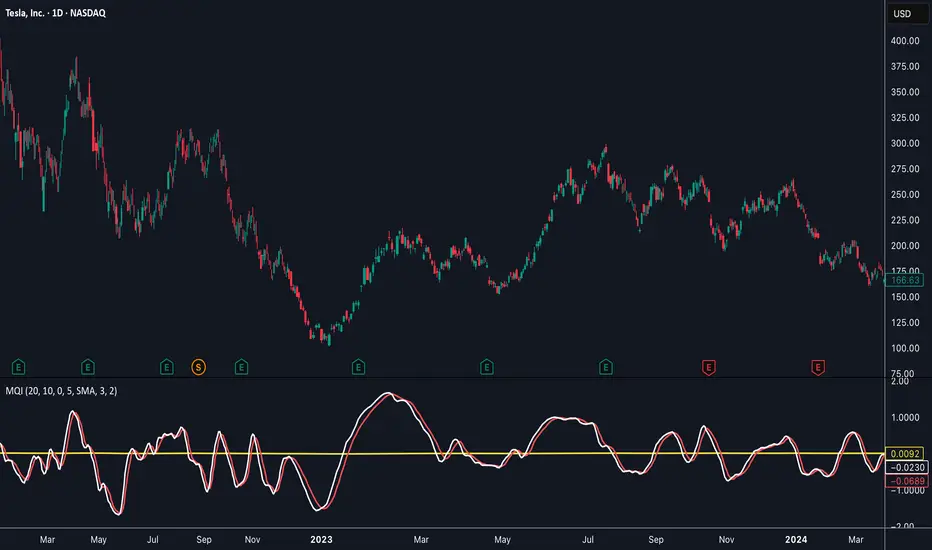
Breadth-Force Oscillator (BFO)Welcome to the Breadth-Force Oscillator! This is a measure of the cumulative volume index relative to price action, and is used for swing trading.
How to read:
This indicator is read primarily through divergences in price, when the BFO is going down that is indicative of an uptrend and when it is going up that is indicative of a downtrend. Changes in the BFO direction give foresight towards shifts in trends.
Features:
This indicator is highly adjustable, and depending on how you adjust it, it may change the results of how you interpret it. This indicator includes multiple smoothing options to reduce noise on smaller time frames and gain more foresight to macro-trends in a given market, and other adjustable features which can be used to further customize.

Deneme Elmas Formasyonu 2.0Elmas Formation 2.0 is a proprietary, invite-only market analysis indicator designed to identify high-quality momentum and trend alignment across multiple internal layers. Advanced parameter controls (Dia / Mond / EON) are available only in the Pro version.
Trial users see a protected visualization while the core engine remains fully active.

Black Arrow Wave Trend
Summary:
Goal was to add FIB Levels to the "WaveTrend with Crosses ". This tool is trying to identify if FIB levels in the "WaveTrend" oscillator has any relation to price action in candles.
Details:
1) Made FIB levels adjustable in the input sections under settings. Adjust to your needs.
2) Blue ribbon represents bullish waves and red ribbons represents bearish waves.
3) Purple line is at .5 "Fair Value", Two Gold lines represent "Golden Pocket", Red line represents the .786
How to use:
1) Observe either bullish or bearish waves enter FIB levels that are color coded.
2) Observe as momentum slows if following waves mark lower FIB levels.
3) Zero line is at the bottom color = grey.
4) As momentum ribbons momentum slows, this may indicate a reversal in momentum.
Probability levels:
1) Lowest: Purple line is "Fair Value" at 50% pullback. Reversal in momentum chance is weak.
2) Medium: Gold Double lines are the "Golden Pocket". Reversal in momentum chance is medium.
3) Highest: Red Line as a higher Probability for a Reversal in momentum.
Please let me know if there are any changes or items I should add.
This would be best used if combined with a support and resistance indicator.

ALFA BUY IndikatorThis indicator is an improved version of the Mucip + Yağız indicator. I have been using it smoothly for the past 3 months.
I use it on futures markets for the three major coins such as BNB/USDT, BTC/USDT, and ETH/USDT.
My usage logic is as follows: on average, it generates around 2 signals per coin per day.
For each trade, I enter positions using 4–5% of my total capital.
I use 25x leverage on ETH and BNB, and 50x leverage on BTC.
My take-profit levels are 0.25% for BTC and 0.5% for the others, which results in approximately 10–12% profit per trade.
Overall, the average daily capital growth is around 2–3%.
Note: I use a trading bot for executions, because the indicator is designed for 2-minute charts, and it is almost impossible to catch the signals manually.
So far, everything has been working flawlessly, and it performs best on 2-minute timeframes.

RMO [modded LazyBear] OscillatorBoth Yellow lines mean short or PUT option.. Both BLUE lines mean LONG or Call options. Using this to watch structure, and trend bias. this is only good for entry, and Not stop Loss. Don't be on the wrong side of trend

IED [Harmonic Volatility Edition]IED-H
IED-H (Harmonic Volatility Edition) is a professional mean-reversion and exhaustion detection engine designed to identify institutional stress zones, volatility extremes, and harmonic reversals using a geometry-based statistical framework.
This indicator does not chase trends or breakouts.
Instead, it focuses on detecting when price deviates excessively from its equilibrium and begins to lose efficiency.
⸻
🔬 Core Concept
IED-H measures price deviation from a dynamic trend baseline and projects it into harmonic volatility bands derived from natural square-root ratios:
• √2 → Pulse (normal deviation)
• √3 → Stretch (institutional stress)
• √5 → Extreme (critical exhaustion)
These levels adapt dynamically to market volatility and are not fixed thresholds.
⸻
⚙️ Key Features
• Harmonic Volatility Geometry
Dynamic √2 / √3 / √5 bands scaled by statistical volatility.
• Responsive Wave Engine
Smoothed deviation wave (HMA / RMA modes) for early exhaustion detection.
• Equilibrium Noise Filter
Automatically ignores weak, low-energy oscillations around balance.
• Persistence Logic
Requires prior presence inside overbought/oversold zones to avoid false signals.
• Candle Validation
Signals are confirmed using wick structure and true volatility (ATR-based).
• Harmonic Score (Debug Mode)
Quantifies how deeply price penetrates harmonic stress levels.
• Institutional Visualization
Optional on-chart boxes highlighting validated harmonic reaction zones.
⸻
🎯 What This Indicator Is Designed For
✔ Mean-reversion trades
✔ Exhaustion & volatility climax detection
✔ Trap zones and institutional reaction areas
✔ Advanced traders who value signal quality over signal quantity
⸻
🚫 What This Indicator Is NOT
✘ Not a trend-following system
✘ Not a breakout indicator
✘ Not designed for momentum chasing
✘ Not a multi-purpose “all-in-one” tool
IED-H is a precision instrument, not a Swiss-army knife.
⸻
🧠 Best Practice
For optimal results, use IED-H within a broader trading framework, preferably alongside:
• Higher-timeframe trend context
• Market structure or session logic
• Risk-controlled execution rules
⸻
⚠️ Disclaimer
This indicator is for educational and analytical purposes only.
It does not constitute financial advice.
Always manage risk and test thoroughly before live trading.

SMA34 + Trend Strength Index Band + RSI50 (STRICT CLEAN)Provide Buy and sell signal basis TSI & RSI.
when TSI crosses 0 buy and sell.

OC Chain_ROC_RSI15-minute indicator that detects a 3-candle “inside” chain where each candle’s open & close remain within the previous candle’s open-close range. Plots horizontal Open/Close levels on candles when ROC(2) moves beyond a configurable ±threshold, and highlights candles when RSI is strong (>55) or weak (< user set level, e.g., 30–32). Adjustable ROC/RSI settings and line extension options.

TWS- RSI+Divergence With Stochestic+Div. v21.0 By AshishThis indicator is for RSI & RSI Divergence. Also you can activate Stochastic (modified level) with divergence.
This is totally new concept. you can try it.

Super Prime Indicator [TraderCloud]⭐🧠 Super Prime Indicator 🧠⭐
ML-Enhanced SMI + Whale Hunter Pro
Super Prime Indicator is an advanced, all-in-one market intelligence tool that combines machine-learning-enhanced SMI, Whale Hunter Pro logic, multi-timeframe trend analysis, and probabilistic market modeling into a single, highly visual oscillator.
Designed for professional crypto traders, this indicator focuses on identifying institutional activity, high-probability reversals, and trend continuation zones with precision.
🔹 Core Components
🧠 Machine Learning SMI (KNN-Enhanced)
Traditional SMI upgraded with K-Nearest Neighbors (KNN) learning
Adaptive overbought / oversold levels based on historical behavior
Feature-based distance analysis (momentum, volatility, slope, etc.)
Optional Kalman, Double EMA, or ALMA filtering
🐋 Whale Hunter Pro System
RSI divergence detection across multiple pivot scales
KDE (Kernel Density Estimation) probability modeling
Institutional bias detection using Open Interest (OI) and CVD filters
Strict / Moderate / Aggressive signal modes
Whale buy/sell zones with visual background highlights
📊 Multi-Timeframe Trend Dashboard
Real-time trend alignment across
1m / 5m / 15m / 1H / 4H / 1D / 1W
Clear bullish / bearish status table for top-down analysis
📈 Advanced Divergence Engine
Regular & hidden divergence detection
Short, medium, and long-term pivot sets
Dynamic divergence line plotting with strength-based visuals
📐 Bayesian Probability Model
Probabilistic market direction estimation
Uses Bollinger Bands & SMA state sequences
Normalized directional probability output for risk assessment
🎯 Trading Use Cases
Identify smart money accumulation & distribution
Spot high-probability reversals before price confirmation
Confirm trend continuation with multi-TF alignment
Filter false signals using OI & CVD confirmation
Combine momentum, structure, and probability in one view
🎨 Visual & UX Features
Neon / color-blind friendly palettes
Gradient-based momentum zones
Clean oscillator design with minimal chart clutter
Whale emoji signals for instant recognition
Programmers Toolbox of ta LibraryA programmer's "Swiss army knife" for selecting functions from the " ta Library by Trading View " during coding. Illustrates the results of the individual library functions. Adds a few extra features. Extensively and uniquely documented.
