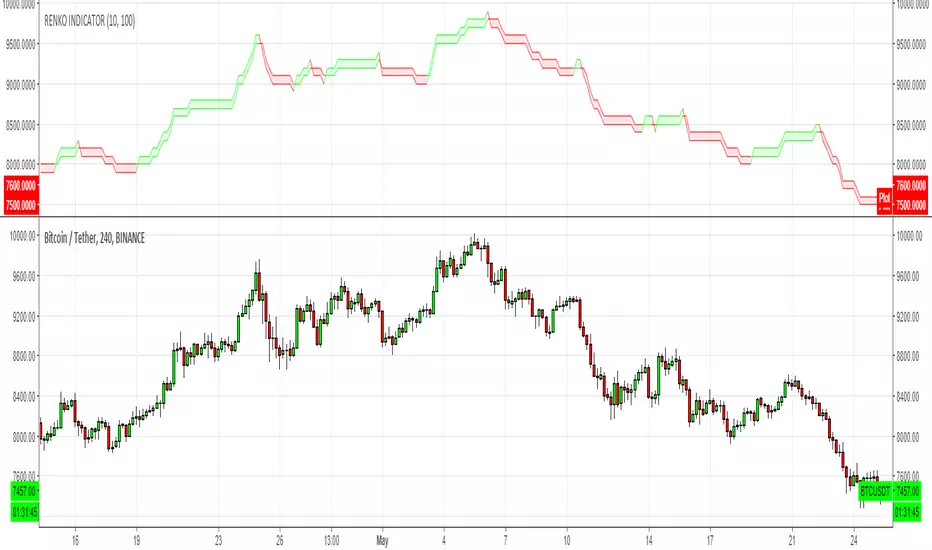
Renko CandlesticksRenko charts are awesome . They reduce noise by only painting a brick on the chart when price moves by a specified amount up/down. When the price reverses, it must go twice the specified amount before a brick is painted. Time is not a factor, just price movement. Sometimes however, you want the pros of a renko chart, but on a regular candlestick chart. This indicator attempts to do just that.
A band is placed around price action showing the upper and lower bounds of what would be the current renko brick. The band only goes up/down when the price action itself moves up/down by the amount you specify. There are several ways of specifying the amount:
Fixed Price Amount: As the name says, you enter the brick size amount, i.e. the amount the price has to move before being in a new brick.
% of Price: This method will calculate the amount the price has to move as a percentage of the price itself. This way as price goes up/down, your brick size will adjust accordingly. Recommended values would be around 1% or less.
% of ATR: This option will make the brick size a percentage of the Average True Range. You can specify the ATR time frame to be different from your current time frame as well as the ATR length. For instance you could be on a 10 minute chart but specify the ATR to be daily with a length of 3 and a percentage amount of 15. This would make your brick size 15% of the Average True Range for the last 3 days. Recommended values are 10 to 20%.
Use this indicator on any time frame, even the 1 minute as the renko bands span the price action the same way on any time frame easily letting you know whether or not the price has moved appreciably, regardless of how much time has passed.
You can also set alerts easily, simply set the alert to crossing and choose “Renko Candlesticks” instead of “Value”. You will then see the options for the renko upper and lower bounds.
Tested on Bitcoin with the following values:
Fixed Price Amount: 30 ($30)
% of Price: 0.45 (if Bitcoin is $7000 then the brick size would be $31.50)
% of ATR: 15%, ATR Time Frame: 1D, ATR Length: 3 (3 days)
Renko


[AGHYAD]EMA-CROSS+CCI_BASED_ON_RENKO////////////////////////////////////////////
// 4 HOURS
// -------------------------- BUY --------------------------
// 1. MUST: Set Time_Frame To 1D
// 2. STRONG: Any Green Signal!!
////////////////////////////////////////////
EMA-CROSS + CCI SIGNALS BASED ON RENKO WITH CUSTOM TIME-FRAME

RENKO INDICATOR OVERLAY by CryptoJoncisA very simple and basic renko indicator for any time frame and ticker.
Please be aware, the minimum value for traditional renko box size = 0.0001 so if you are using this indicator for trading with cryptocurrencies, it might be better to use ATR for that.
Can be merged together with main chart for better performance.
Consider a tip if you find this helpful
BTC: 3FiBnveHo3YW6DSiPEmoCFCyCnsrWS3JBR
ETH: 0xac290B4A721f5ef75b0971F1102e01E1942A4578
AGHYAD_Renko+Sniper+PAB+TZ+ICHIMOKU_V21. MUST: RENKO ATR 2 YELOOW
2. STRONG: SNIPER 8,8 BUY SIGNAL
3. WEAK: TZ 6,6 BUY SIGNAL
========= SELL =========
1. STRONG: SNIPER 8,8 SELL SIGNAL
2. WEAK: TZ 6,6 SELL SIGNAL
3. WEAK: RENKO ATR 2 RED
=========NOTE=========
RENKO > SNIPER > TZ
6 minutes ago
the sniper buy signal is now based on renko

AGHYAD_Renko+Sniper+PAB+TZ========= BUY =========
1. MUST: RENKO ATR 3 YELOOW
2. STRONG: SNIPER 8,8 BUY SIGNAL
3. WEAK: TZ 6,6 BUY SIGNAL
========= SELL =========
1. STRONG: SNIPER 8,8 SELL SIGNAL
2. WEAK: TZ 6,6 SELL SIGNAL
3. WEAK: RENKO ATR 3 RED
=========NOTE=========
RENKO > SNIPER > TZ

[Autoview][Alerts]Dual MA Ribbons R0.12 by JustUncleLSorry I have had trouble getting the TradingView to point to the "Alerts" script instead of the "Backtest".
This is the Alerts part of this pair of Scripts. This part creates alerts to be picked up by the Chrome Add-on.

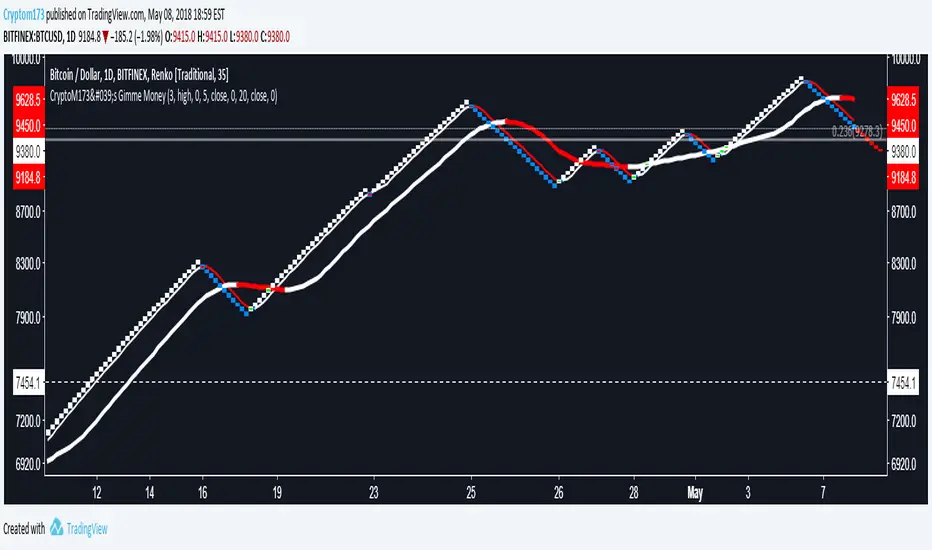
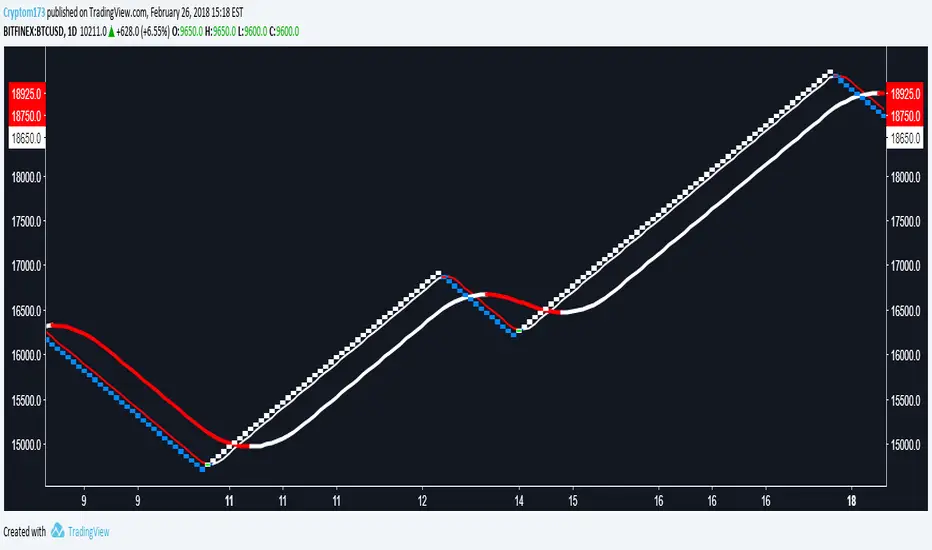
CryptoM173's Gimme MoneyLatest version. Nobody gave me feedback and managing requests to add people became a PITA. Enjoy.
I like money, you like money, this set up has the potential to make a LOT of it. That being said, I do NOTmake any warranties of this making you money, nor do I guarantee you will NOT lose money. In the end, you're the one configuring it and interpreting the results. Providing that you DO set it up correctly and it makes you obscene amounts of money, donations are always welcome (addresses below).
Before you start, it's probably you read EVERYTHING below.
You'll have to do some tweaking of the MA's to find a strat that best suits your needs. It is an indicator you're welcome to use to assist in your trading decisions. I made this script for renko charts and trading bitcoin -1.64% because the standard strat wasn't working out. if you find you're getting a lot of consecutive colored bars or crosses on Renko, you may need to switch from ATR 14 to something like Traditional 50. You will need to adjust the "box value" for traditional renko to fit the asset you're working with, on the time frame you're trading on. Smaller values (i.e. on bitcoin -1.64% I use a box value of 50 on 4hr and 1D with absurd success) but you need to make sure they're not too small, otherwise small moves may appear larger than they are, resulting in a bunch of break-even trades. If you're going to be trading cryptocurrency, it's easiest to switch back to ATR14 to get an idea of the Average Trading range to have a reference point to start from trading btc -1.64% (i.e .000034 rather than 50).
It's a great tool if you're looking to carry both swap and futs positions and keep an eye on the short term swap opportunities while monitoring the status of your futs position and help decide whether or not to close a long at a correction or not and while this strategy has been most effective for me with Renko bars, it's been very useful for monitoring futs positions on traditional charts.
For access, feel free to DM -0.34% me on twitter, @CryptoM173
If you're the generous type, feel free to donate Bitcoin to: 3BMEXWz6Es7iLdi9zAyMWWHHZPNbMKPqrV
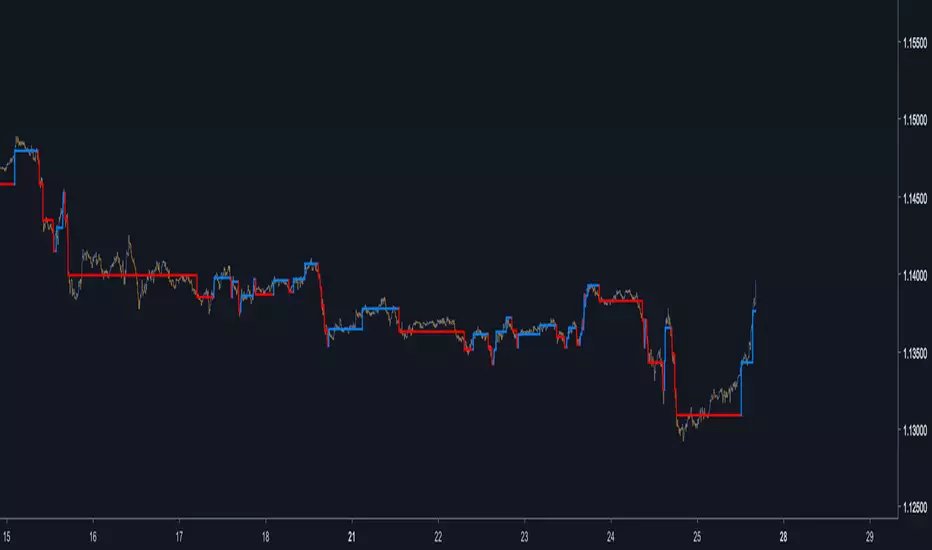
Auto-FilterA least squares filter using the Auto line as source, practical for noise removal without higher phase shift.
Its possible to create another parameter for the auto-line length, just add a parameter Period or whatever you want.
r = round(close/round)*round
dev = stdev(close,Period)
Hope you enjoy :)
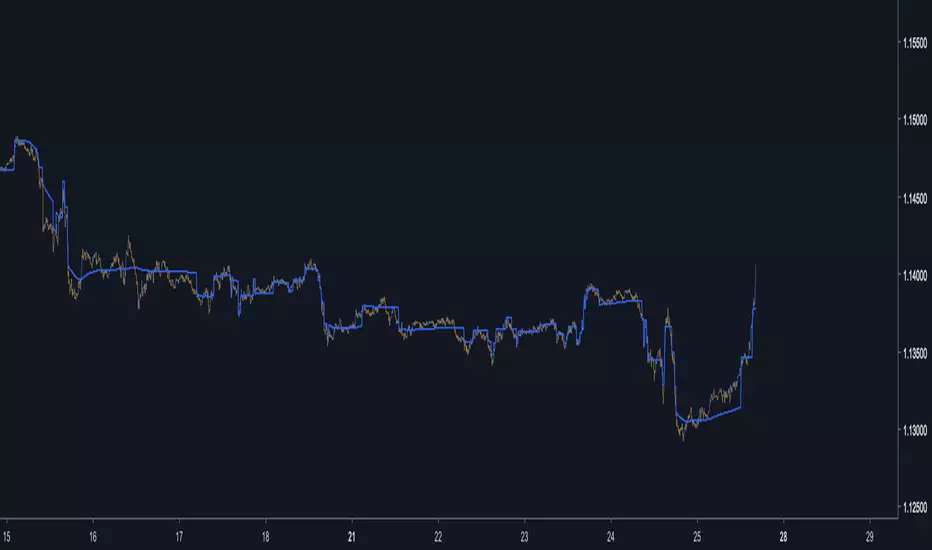
Auto-LineAn indicator inspired by the Renko chart.Instead of using a static box size we use standard deviation, this make the indicator more reactive to the market state.
If the indicator show no values then you have to round the price to the nearest integer, for that use the round parameter.
Hope you enjoy :)
Alex: ConsUD Alert indicatorCustom strategy that was developed for a Backtest-Rookies development service customer. Published for verification, testing and acceptance.
If you are interested in development services send me a message or visit the backtest-rookies (.com) webiste for more information
Consecutive Up/Down Days - Custom Indicator
The indicator builds upon the built-in consecutive up/down days strategy script but with some additional features:
The strategy has been converted to an indicator
Alerts have been added for entries
Position Simulation: Entry signals only happen once per long / short direction.
Plot real high / low candle data (the script is assumed to run on Renko candles)
Plot real simulated entry price at the open of the bar following an entry signal
Plot an EMA

KTS 0.1a [BETA]VERY early release of KTS for those who have contributed to the early efforts of the upcoming Kawaii Trading Suite package.
When you first add this to a chart- nothing will happen. You need to enable the features you want in the indicator's settings menu. Many of these are based off of indicators i've already published (and are linked for in-depth description). The following features available:
Daily Support/Resistance levels
Hourly Support/Resistance levels
General Support/Resistance levels
The three above use the same algorithm but are designed for different timeframes.
Renko Bar Overlay (overlays a Renko chart on any timeframe you want)
Renko Signal Overlay (for those who want to know when renkos go green/red without the giant overlay)
The two above indicators use 1D renkos by default (since that's the shortest TV lets free accounts use) but you can use any timeframe you wish in settings.
Alt Sentiment Signal overlay (Simple up/down arrow when altcoin sentiment changes)
Witchcraft support/resistance clouds (can be toggled individually)
Planned but not-yet-finished features include:
Ichimokou Clouds
Golden Cross signal
Plus many more things I haven't posted anywhere else yet. Be aware that beyond this point, anyone wishing to try this product will have to pay a reasonable fee. Please do not message me asking for access to private indicators if you have no intention of paying for them.

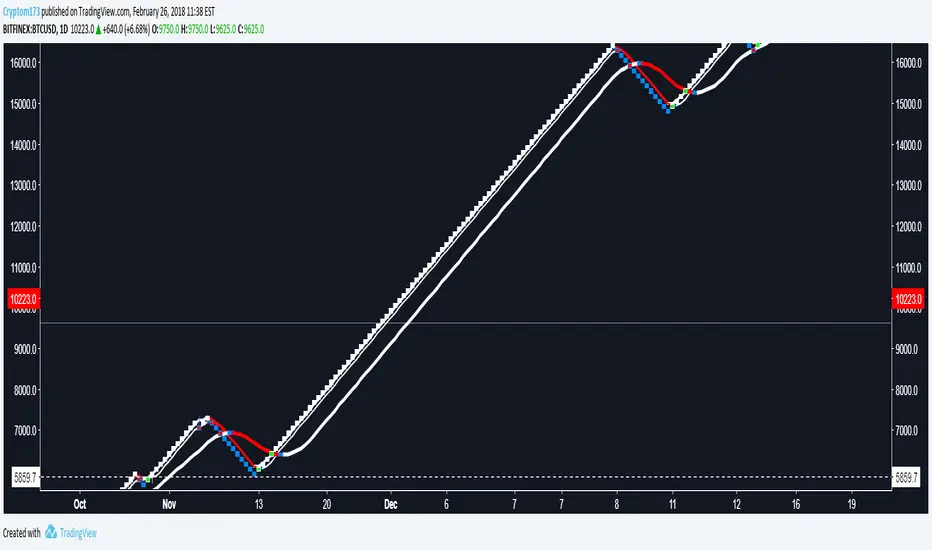
CryptoM173's Gimme Money v1.1I like money, you like money, this set up has the potential to make a LOT of it. That being said, I do NOT make any warranties of this making you money, nor do I guarantee you will NOT lose money. In the end, you're the one configuring it and interpreting the results. Providing that you DO set it up correctly and it makes you obscene amounts of money, donations are always welcome (addresses below).
Before you start, it's probably you read EVERYTHING below.
You'll have to do some tweaking of the MA's to find a strat that best suits your needs. It is an indicator you're welcome to use to assist in your trading decisions. I made this script for renko charts and trading bitcoin because the standard strat wasn't working out. if you find you're getting a lot of consecutive colored bars or crosses on Renko, you may need to switch from ATR 14 to something like Traditional 50. You will need to adjust the "box value" for traditional renko to fit the asset you're working with, on the time frame you're trading on. Smaller values (i.e. on bitcoin I use a box value of 50 on 4hr and 1D with absurd success) but you need to make sure they're not too small, otherwise small moves may appear larger than they are, resulting in a bunch of break-even trades. If you're going to be trading cryptocurrency, it's easiest to switch back to ATR14 to get an idea of the Average Trading range to have a reference point to start from trading btc (i.e .000034 rather than 50).
It's a great tool if you're looking to carry both swap and futs positions and keep an eye on the short term swap opportunities while monitoring the status of your futs position and help decide whether or not to close a long at a correction or not and while this strategy has been most effective for me with Renko bars, it's been very useful for monitoring futs positions on traditional charts.
For access, feel free to DM me on twitter, @CryptoM173
If you're the generous type, feel free to donate Bitcoin to: 3BMEXWz6Es7iLdi9zAyMWWHHZPNbMKPqrV
CryptoM173's Gimme MoneyI like money, you like money. You'll have to do a considerable amount of configuration. As of right now, I'm using just the last two sets (confirming and Big Picture) on the input page and the last 4 color bars that correspond to those two sets on the style page.
Renko Price Bars Overlay// Shows the price renko bars (or range bars) instead of the PERIOD renko
// bars that are integrated into Trading View. The normal renko bars that
// Trading View offers only consider the drawing of a new brick when the
// price closes above or below the required brick size. This can produce
// misleading charts since depending on the time interval of a chart, new
// bricks may or may not be drawn. True price renko bars will draw a new
// brick immediately upon the price exceeding the next target brick size.
// When running this script in "Traditional" mode, the painting of the
// brick overlay band is INDEPENDENT of the chart interval. If price
// exceeds the required target price for the next brick, the band is
// updated immediately, instead of waiting for the price bar on the chart
// interval to close first. The brick starting anchor point will attempt
// to be a "nice number" at a round interval for the chart ticker. For
// example, if viewing EURUSD with the box size equal to 50 ticks/pips,
// the open and close prices will take the form of 1.2100, 1.2150, 1.2200,
// 1.2250, and so on. This is the same behavior as the normal traditional
// Renko bars in Trading View and other major trading platforms such as
// Meta Trader.
// Use the tick size in traditional mode to specify the block size, in
// ticks. This may give interesting results in FOREX pairs... as the tick
// size in Trading View may be 0.00001 instead of the normal pip size of
// 0.0001, so a 10 pip block size may be '100', and not the expected '10'.
// FOREX futures should work in the manner expected, a 10 pip block size
// will indeed equal 0.0010.
// The "ATR" mode functions differently than the Trading View built in
// version. The block size is updated each time the range is exceeded.
// In Trading View, when using the ATR mode, the ATR is the last ATR
// value calculated on the ENTIRE data interval, and is applied to all
// past data. You can see this when you press the '+' sign of the ticker
// in the top left of the chart window and you will see the brick size
// as a constant, the brick size is not a function of the ever changing
// ATR value of the price action. The block size of this script is not
// updated for each price candle (i.e. each 1HR on a 1HR chart), instead
// it is updated only when the price thresholds are exceeded requiring a
// the band to be updated. At that point the current ATR is considered
// and the brick size is updated.
// Options exist to show the current high and low of the brick, and to
// show the required levels that the price must exceed to draw a new
// brick and update the band.
Please leave comments if you notice any bugs or would like any new features added. I don't find much use for plotting the H/L of the current renko candle, but I have seen some request it in the past.
Cheers.

Renko SignalAn overlay for any chart telling you when Renkos are changing direction.
Does offer some slight additional noise over traditional Renko charts in backtesting, but this is due to the way the actual Renko chart repaints and NOT due to errors in my script (nor is it something fixable, as far as I'm aware).
You need access to Renko charts to use this indicator.

Renko GuppyI like renko blocks and I like guppy mma's so I decided to put together a study for using them with each other while I'm using other bar types.
Additionally, I added two line plots for two different renko sizes of your choice. This has a nice benefit of being able to see how price appears to be ranging between the "block sizes".
Being able to see the lines contract, especially within these "ranging" zones, gives you a great indication of an impending breakout.
The example you see above shows the guppy block size set to 15, the white line is 50 and the blue is 100. It should hopefully illustrate the idea.
The current close price (red line) can also be optionally plotted as a separate moving average, or simply the close price. I defaulted it to a 3 period EMA to smooth it out a bit so it flows a bit better with the guppy ma's. It's helpful to see how price is actually moving around within these Renko blocks.
Pick either Traditional or ATR block sizes.
There are the fast (5) / slow (5) moving averages.
Pick your poison: EMA (default), SMA, WMA, SMMA, DEMA, TEMA, HullMA, ZEMA, TMA, SSMA
There's some options to disable/enable things as you see fit.
The defaults are set to my own needs so you'll probably want to change block sizes for you preferences/symbols/timeframes.
Note: This is presumably only usable for those of you with access to Renko charts on here.

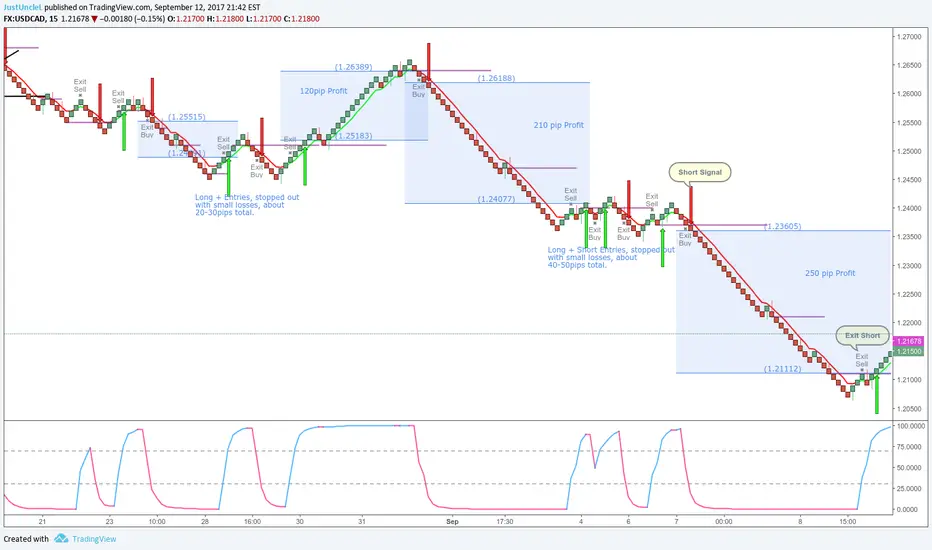
Renko+Moving Average+RMI Alert R3 by JustUncleLThis script idea is designed to be used with 10pip brick (recommended) Renko charts. It combines the Renko price action with a directional coloured EMA (default length 6) and a RMI (instead of the usual RSI) indicator to provide entry and exit signals. RMI is bit like RSI with a built-in momentum factor and works well with Renko.
Signals can optionally be filtered by Daily or Weekly Open, where by only trade long above open and short below open (this option is enabled by default). Exit occur when EMA or RMI reverses direction, or optionally (disabled by default) when the Renko prints a brick in the reverse direction. Each Entry and Exit signal creates an Alertcondition that can be picked up by the TradingView Alarm system.
TIP: To get 10pip Bricks set Renko to "Traditional" type bricks and 0.001 for non-JPY currency pairs, and 0.1 for JPY currency pairs. Also set chart Time frame to 5min or 15mins.
References:
TheLark Relative Momentum Index (RMI)
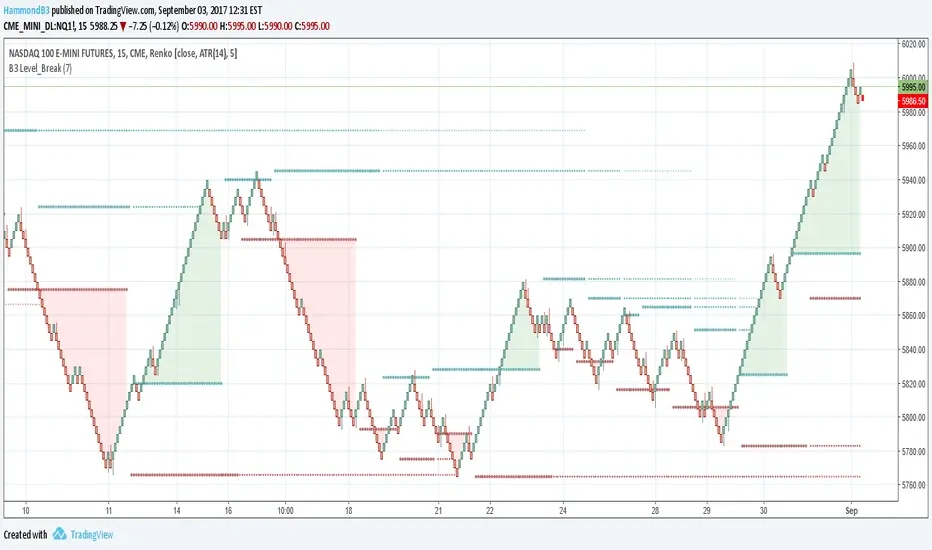
B3 Level_BreakUsable on any style chart, B3_Level_Break is simply a breakout play off the highest high or lowest low of a period. What makes this script slightly different is that it looks forward and backward for the pivotal point. This line is then carried forward with time decay; they will either erase with time, or erase when crossed by price. So many traders young and old like to draw price level lines, and this indicator certainly helps the lazy person do this.
Hedge Fund firms and trading groups around the market use indicators like this one to bring awareness to the last time price failed to reach further. When these levels are approached again, the cloud-fill will highlight the break outs, but a firm trader isn't always trading the breakout. What a good trader will do is look at the Level 3 data and the Time & Sales to determine if the story of supply and demand is pointing to a breakout, or a reversal (like a double-top or double-bottom).
I have automated this strategy to some varying degrees of success, avoiding the range reversal trades. Like any trend finding indicator, a rangy day will be tough to find a good signal from it. However, if you find range with no breakouts in this indicator, an oscillator of your choosing would be appropriate to trade the reversals within the ranges.
On a NQ1! 5m chart I have been using a length of anywhere from 7 to 16, (higher length gets you out of noise). The higher in interval you go, the less length you likely need. I have been looking at Stochastic turns at OVB OVS in combination with stocks breaking out on this indicator length set to 3 with interval Day or 4-6hr charts. Its a good catch for fading an earnings dip or bump after the call, or simply a confirming entry on the old school stochastic swing trade.
It has been some time since I have made a post. I will continue to post anything I find useful. It's best in the market to find things that work and stick with them, so it should make sense that I don't post as often. Enjoy !! :)
Renko Bar Time by JustUncleLThis indicator in designed to be used with Renko and other price only bars (ie Kagi, LineBreak, Point&Figure) and shows the number of minutes a bar was open before it was confirmed and printed.
NOTE: It will only work on currencies and symbols that are in the 24/5 market, it does account for weekend market close time but does not account for any Forex market holiday close times.
HINTS:
When the BAR TIME is long and the Renko Bricks have wicks, this is an indication of consolidation.
When the BAR TIME is short and the Renko Bricks have no wicks, this is an indication of acceleration.
